Coefficient of Friction
Project Overview
As part of my master’s thesis, I had to determine the Coulomb coefficient of friction between the rotor and the stator of an ultrasonic motor. The contacting materials of the rotor and the stator are quite often specialized materials resulting in their coefficients of friction not being widely documented. As such, I designed a system that was comprised of basic equipment to determine the coefficient.
System Overview
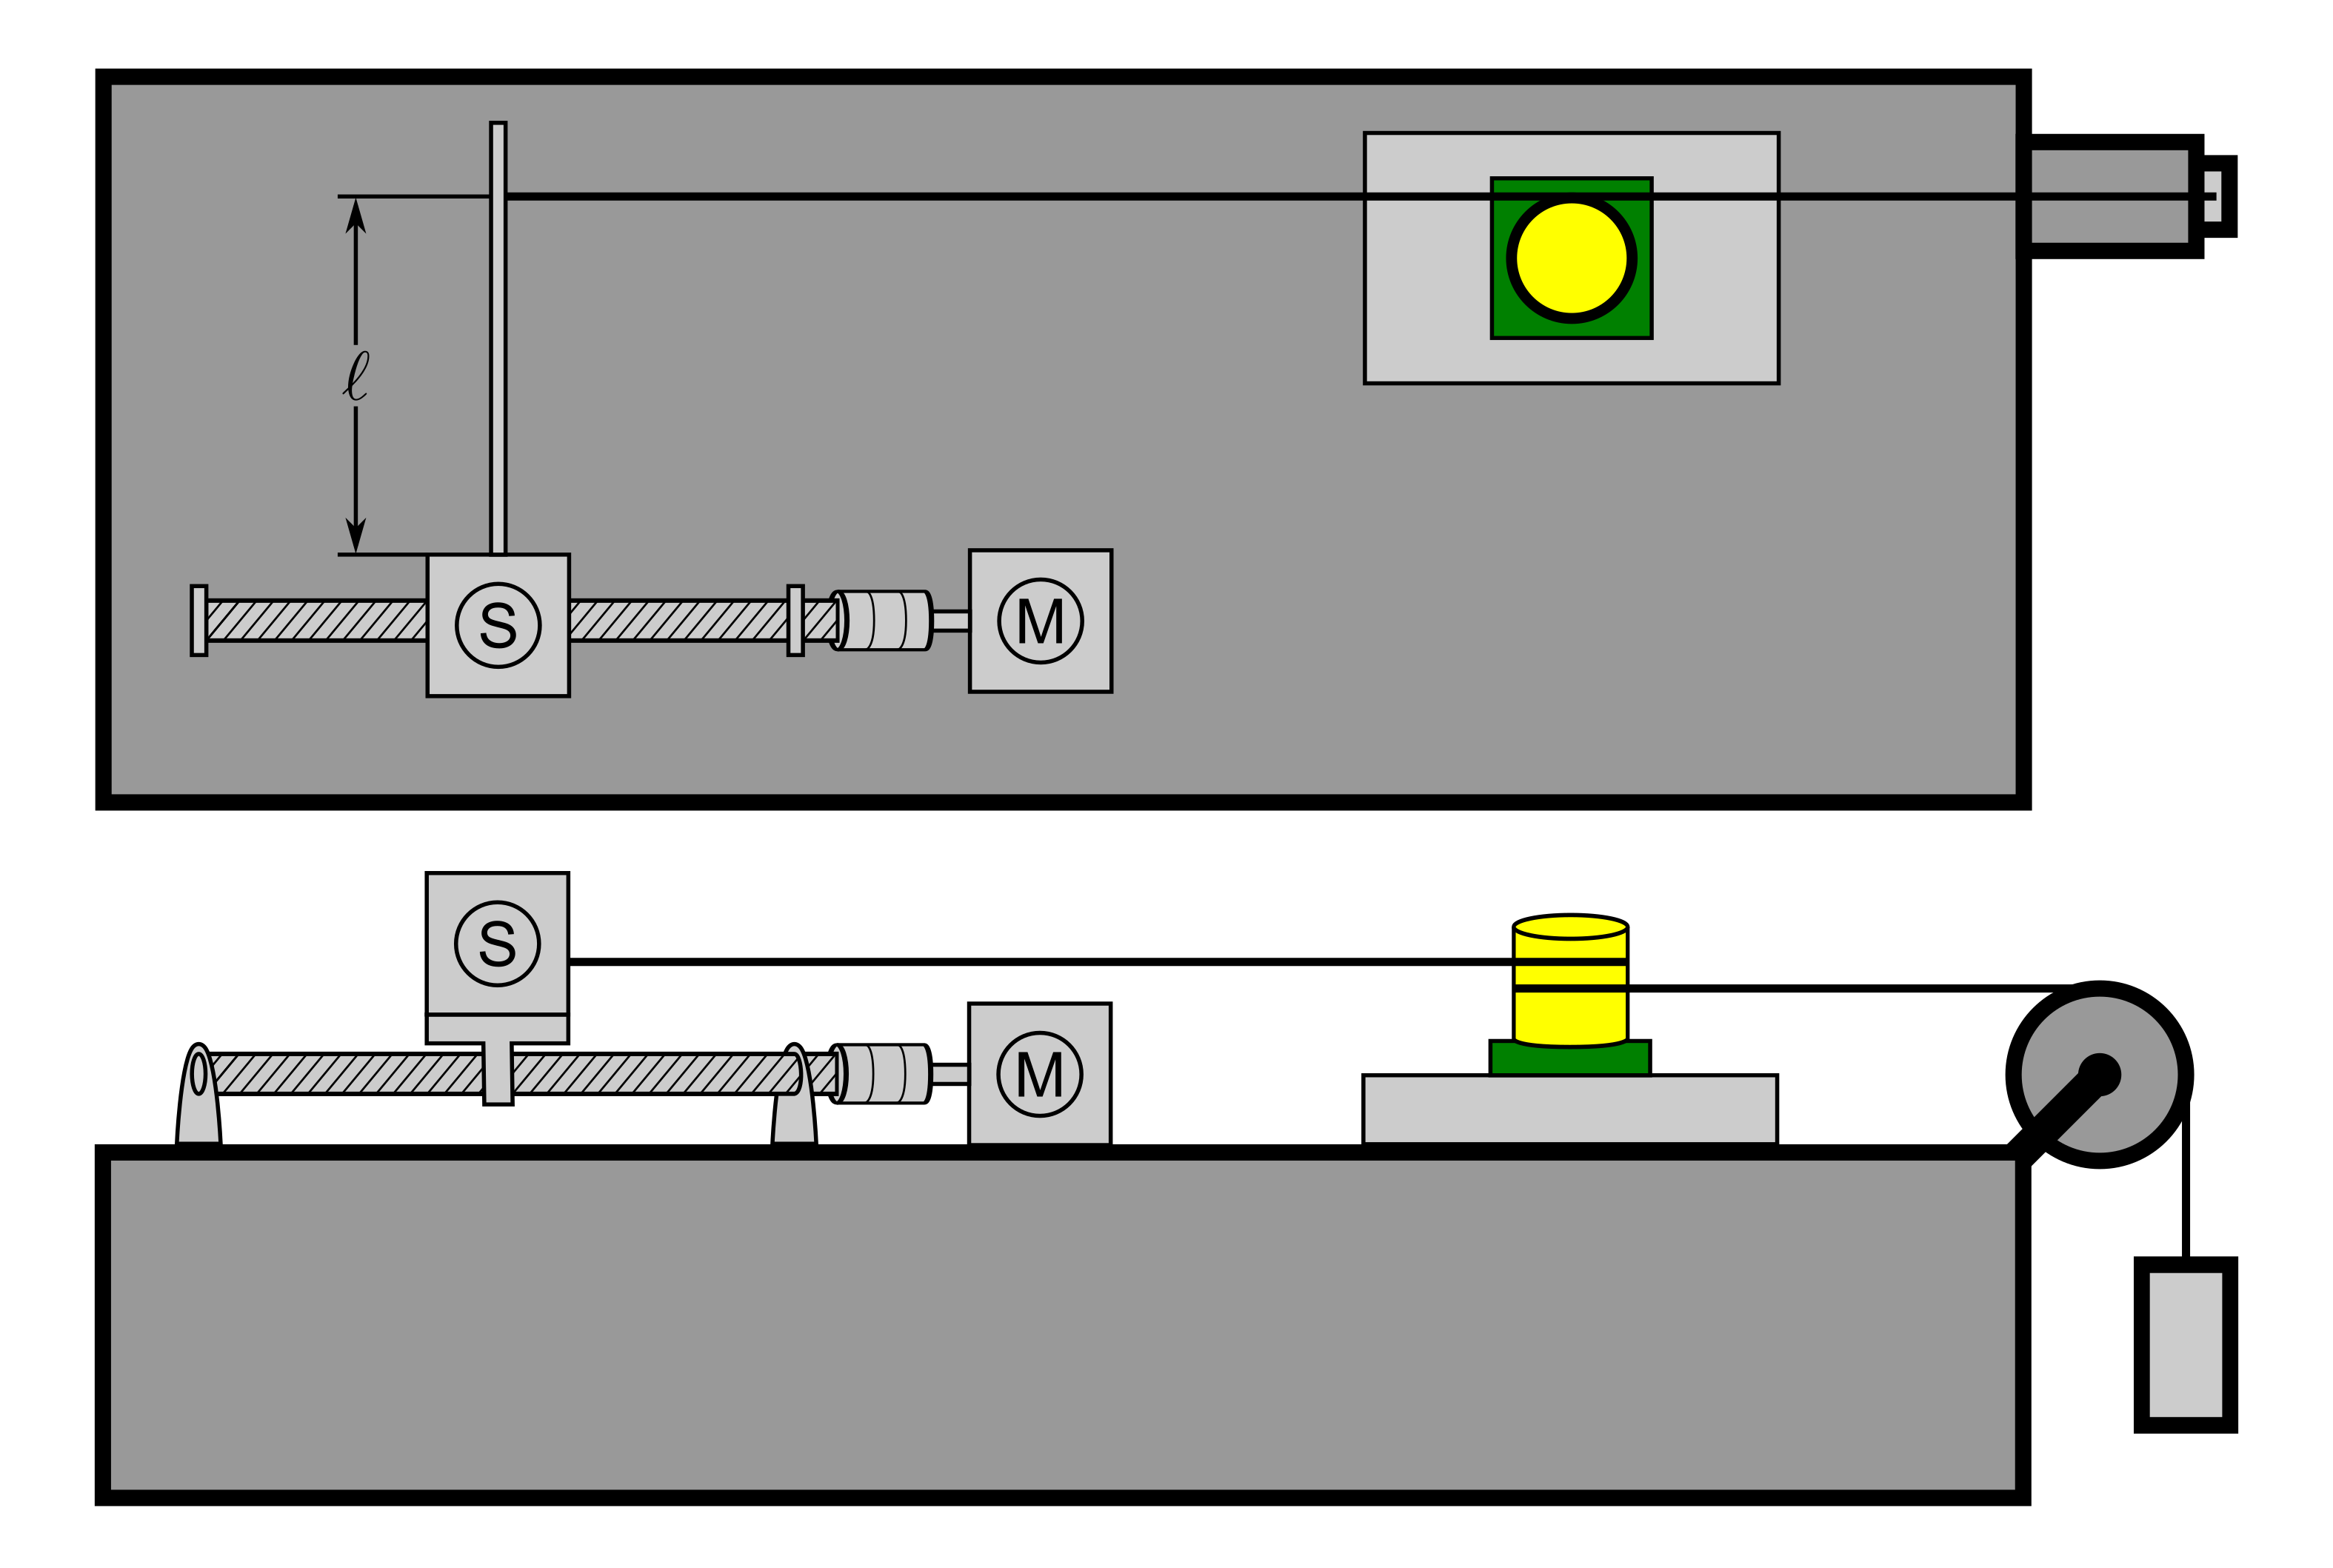
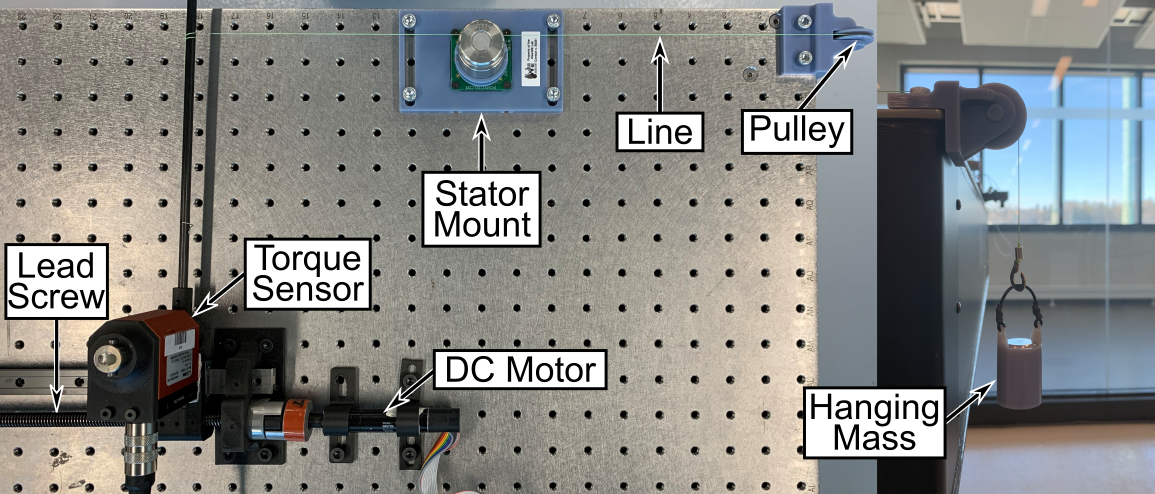
Due to the composition of the rotor and the stator as well as their relative motions, the setup was designed such that it was possible to isolate the forces required to rotate the rotor relative to the stator while they were in contact. This was accomplished by attaching a torque sensor to the carriage of a lead screw, which was coupled to a brushless DC motor. The torque sensor had a linear arm used to anchor a line at a known distance from the pivot point. The stator was anchored to a mount and the rotor had an adapter that would allow the line to be wrapped around it without contacting itself while also holding a test mass to produce a known normal force. The line then continued to a fixed pulley that allowed the line to hang off of a table and be attached to a test mass that kept tension in the line.
As the torque sensor moves, a variety of forces contribute to the torque it senses. To isolate the torque produced by the frictional forces, torque data were collected when the rotor rotated while in contact with the stator, and when it could rotate freely. These two datasets were then subtracted from one another to isolate the torque produced by the frictional forces.
The collected torque data were then used to calculate the respective coefficient of friction by evaluating the dynamic and geometric relations of the setup. However, common models of friction within multibody systems are comprised of three components: Coulomb ( µ ), static ( µs ), and viscous damping friction ( µd ), as shown in the plot below. To accurately determine the Coulomb coefficient of friction, the initial valley in the data must be present.

3D-Printed Parts
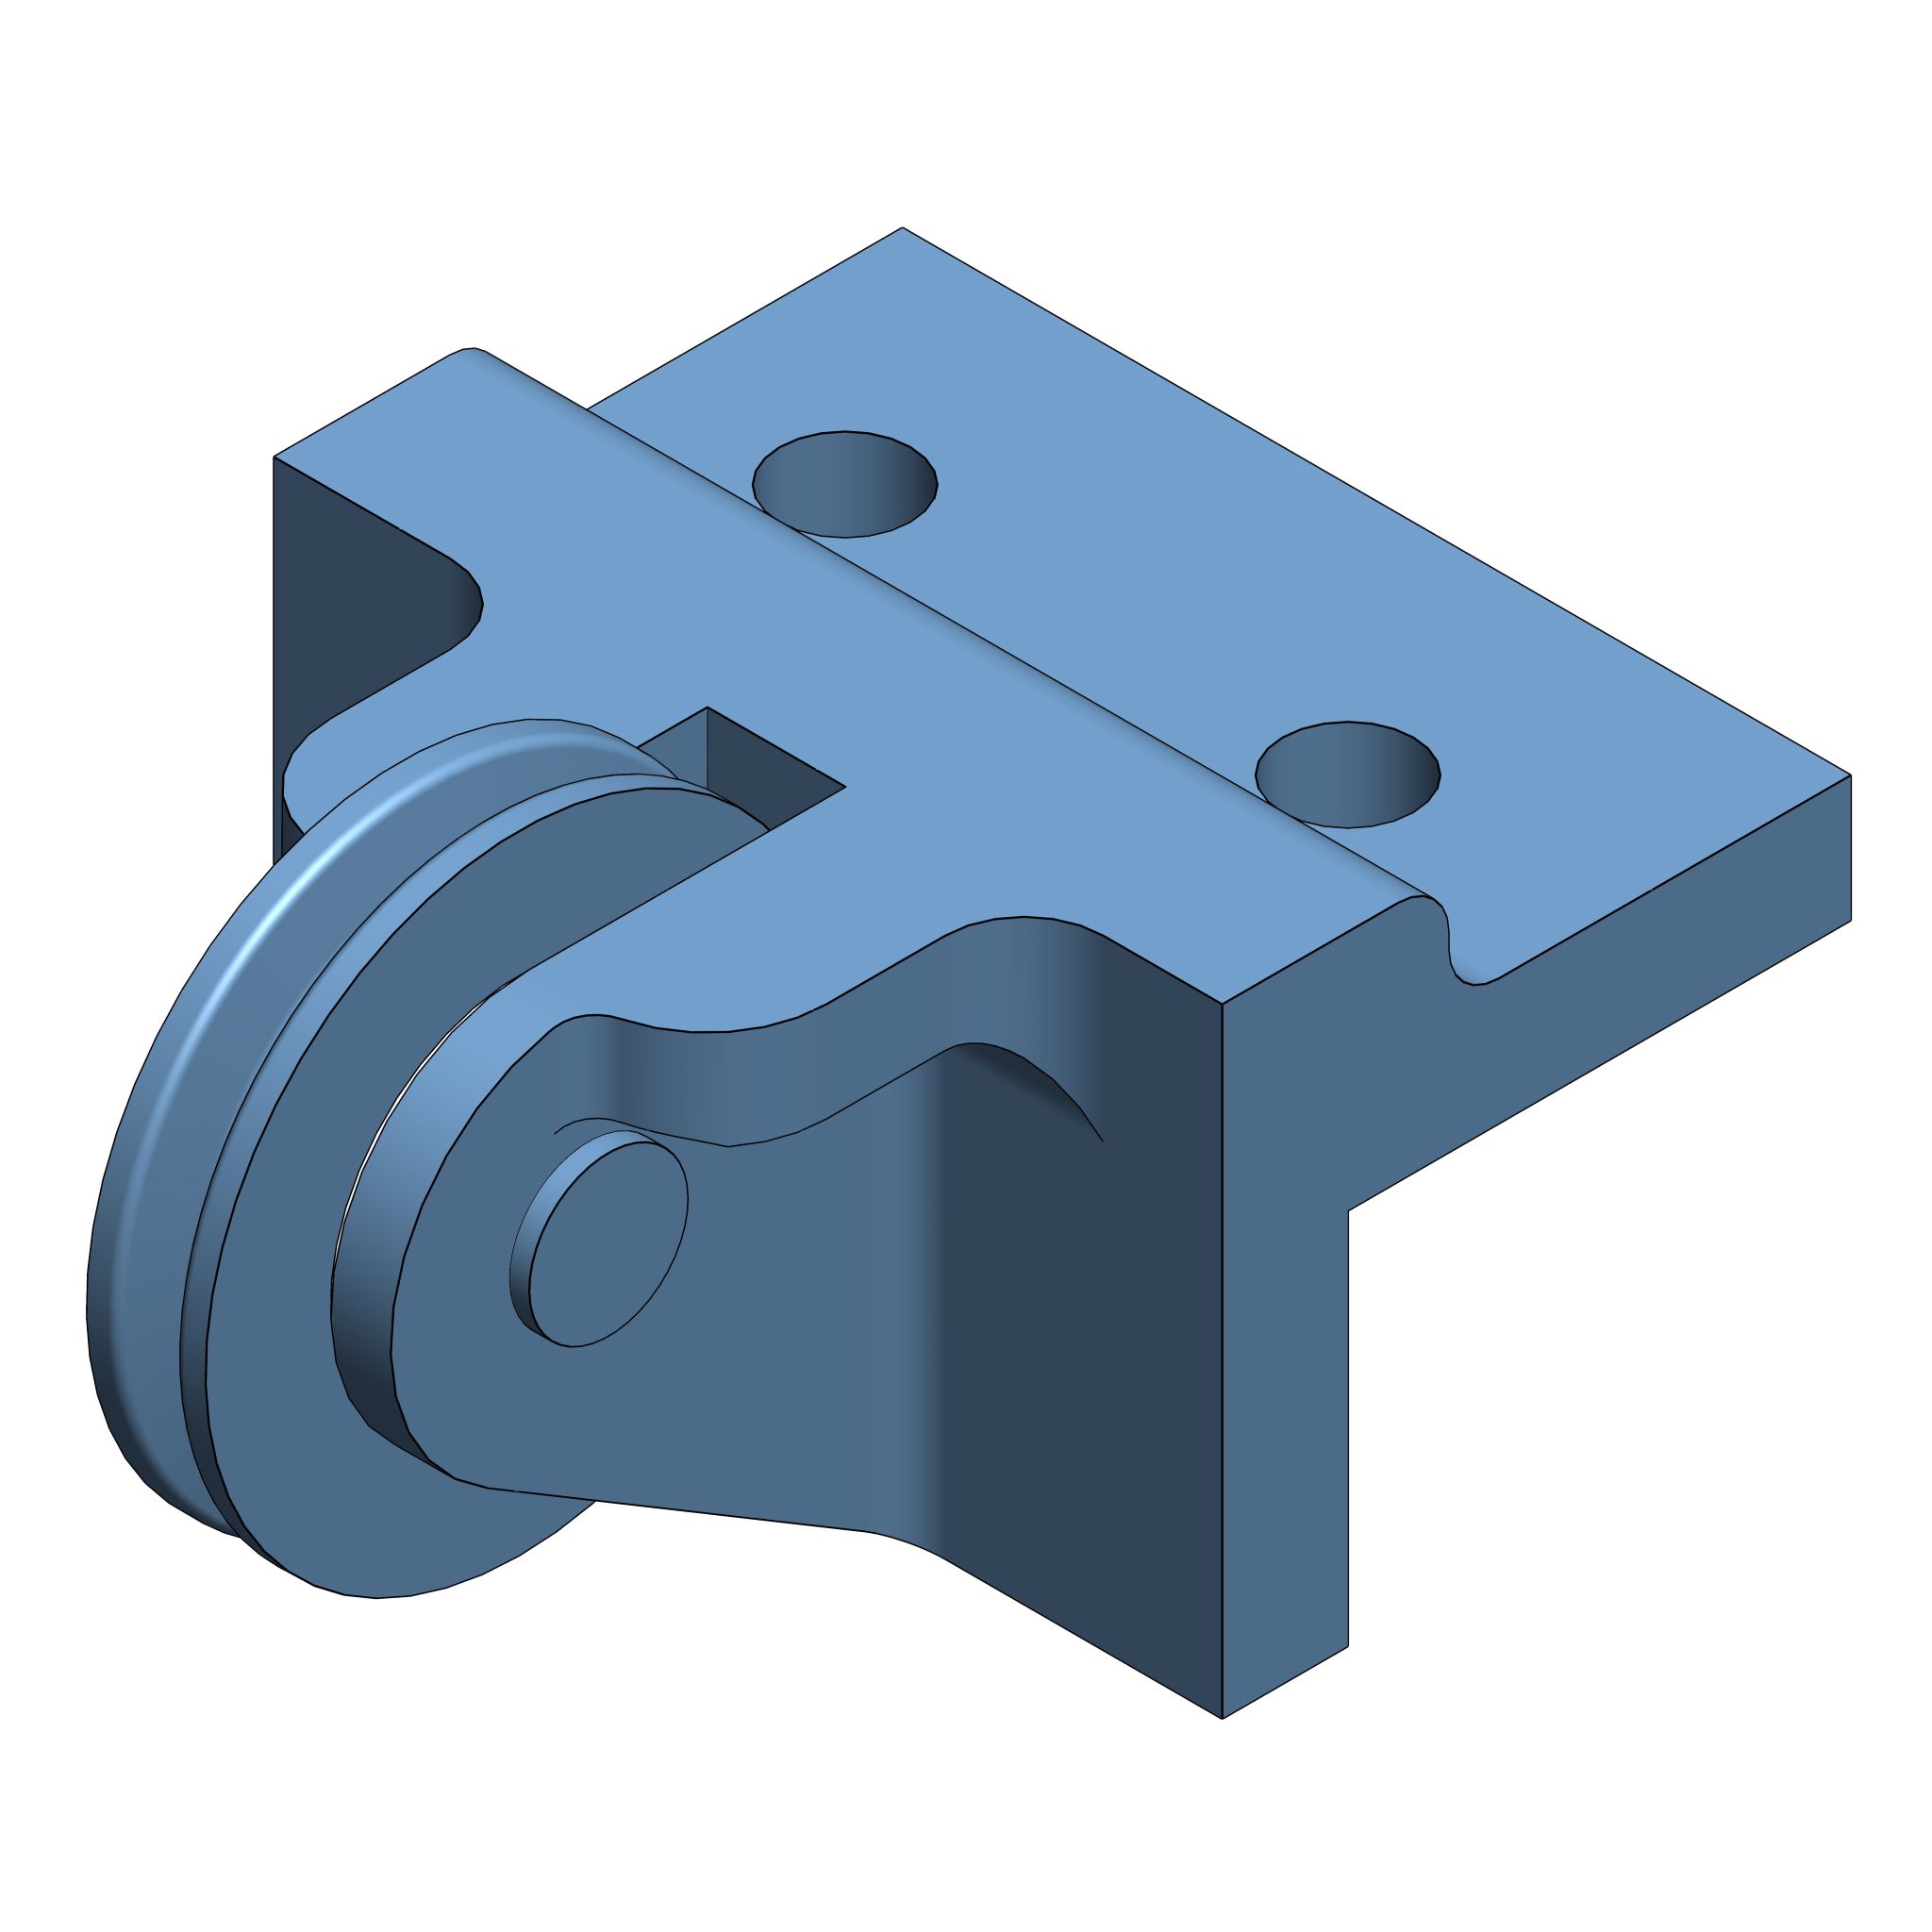
Line pulley.
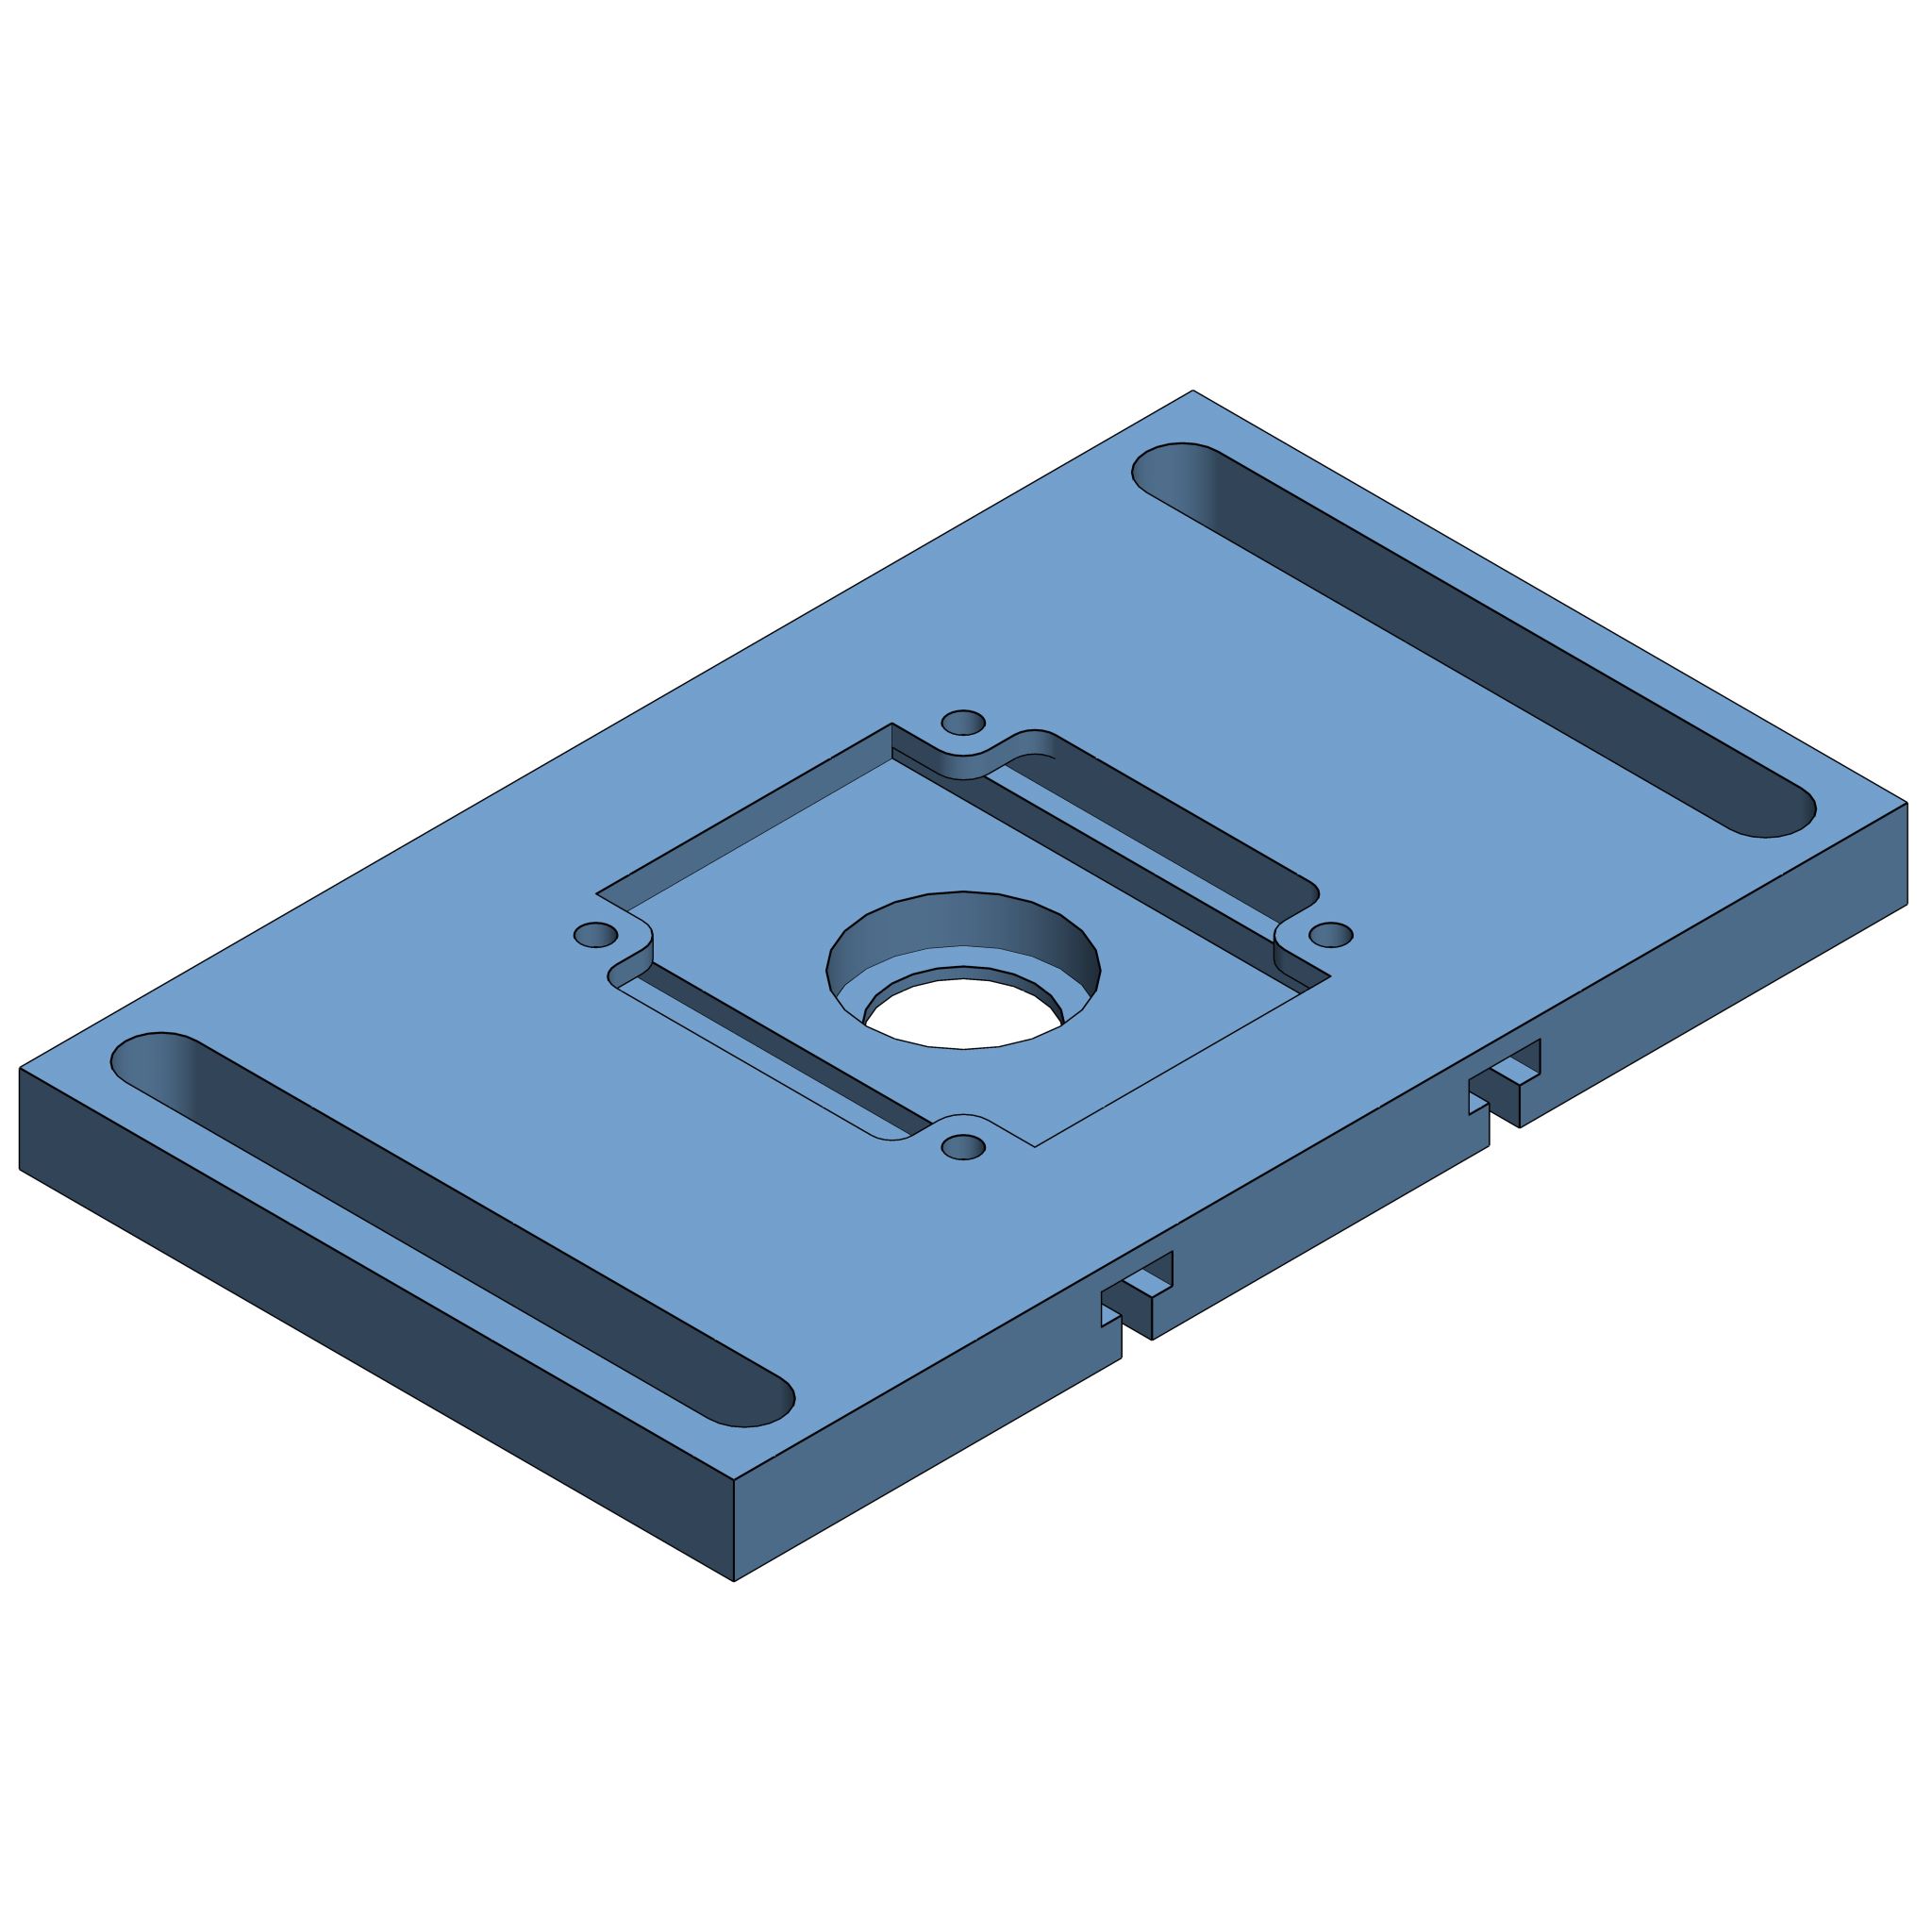
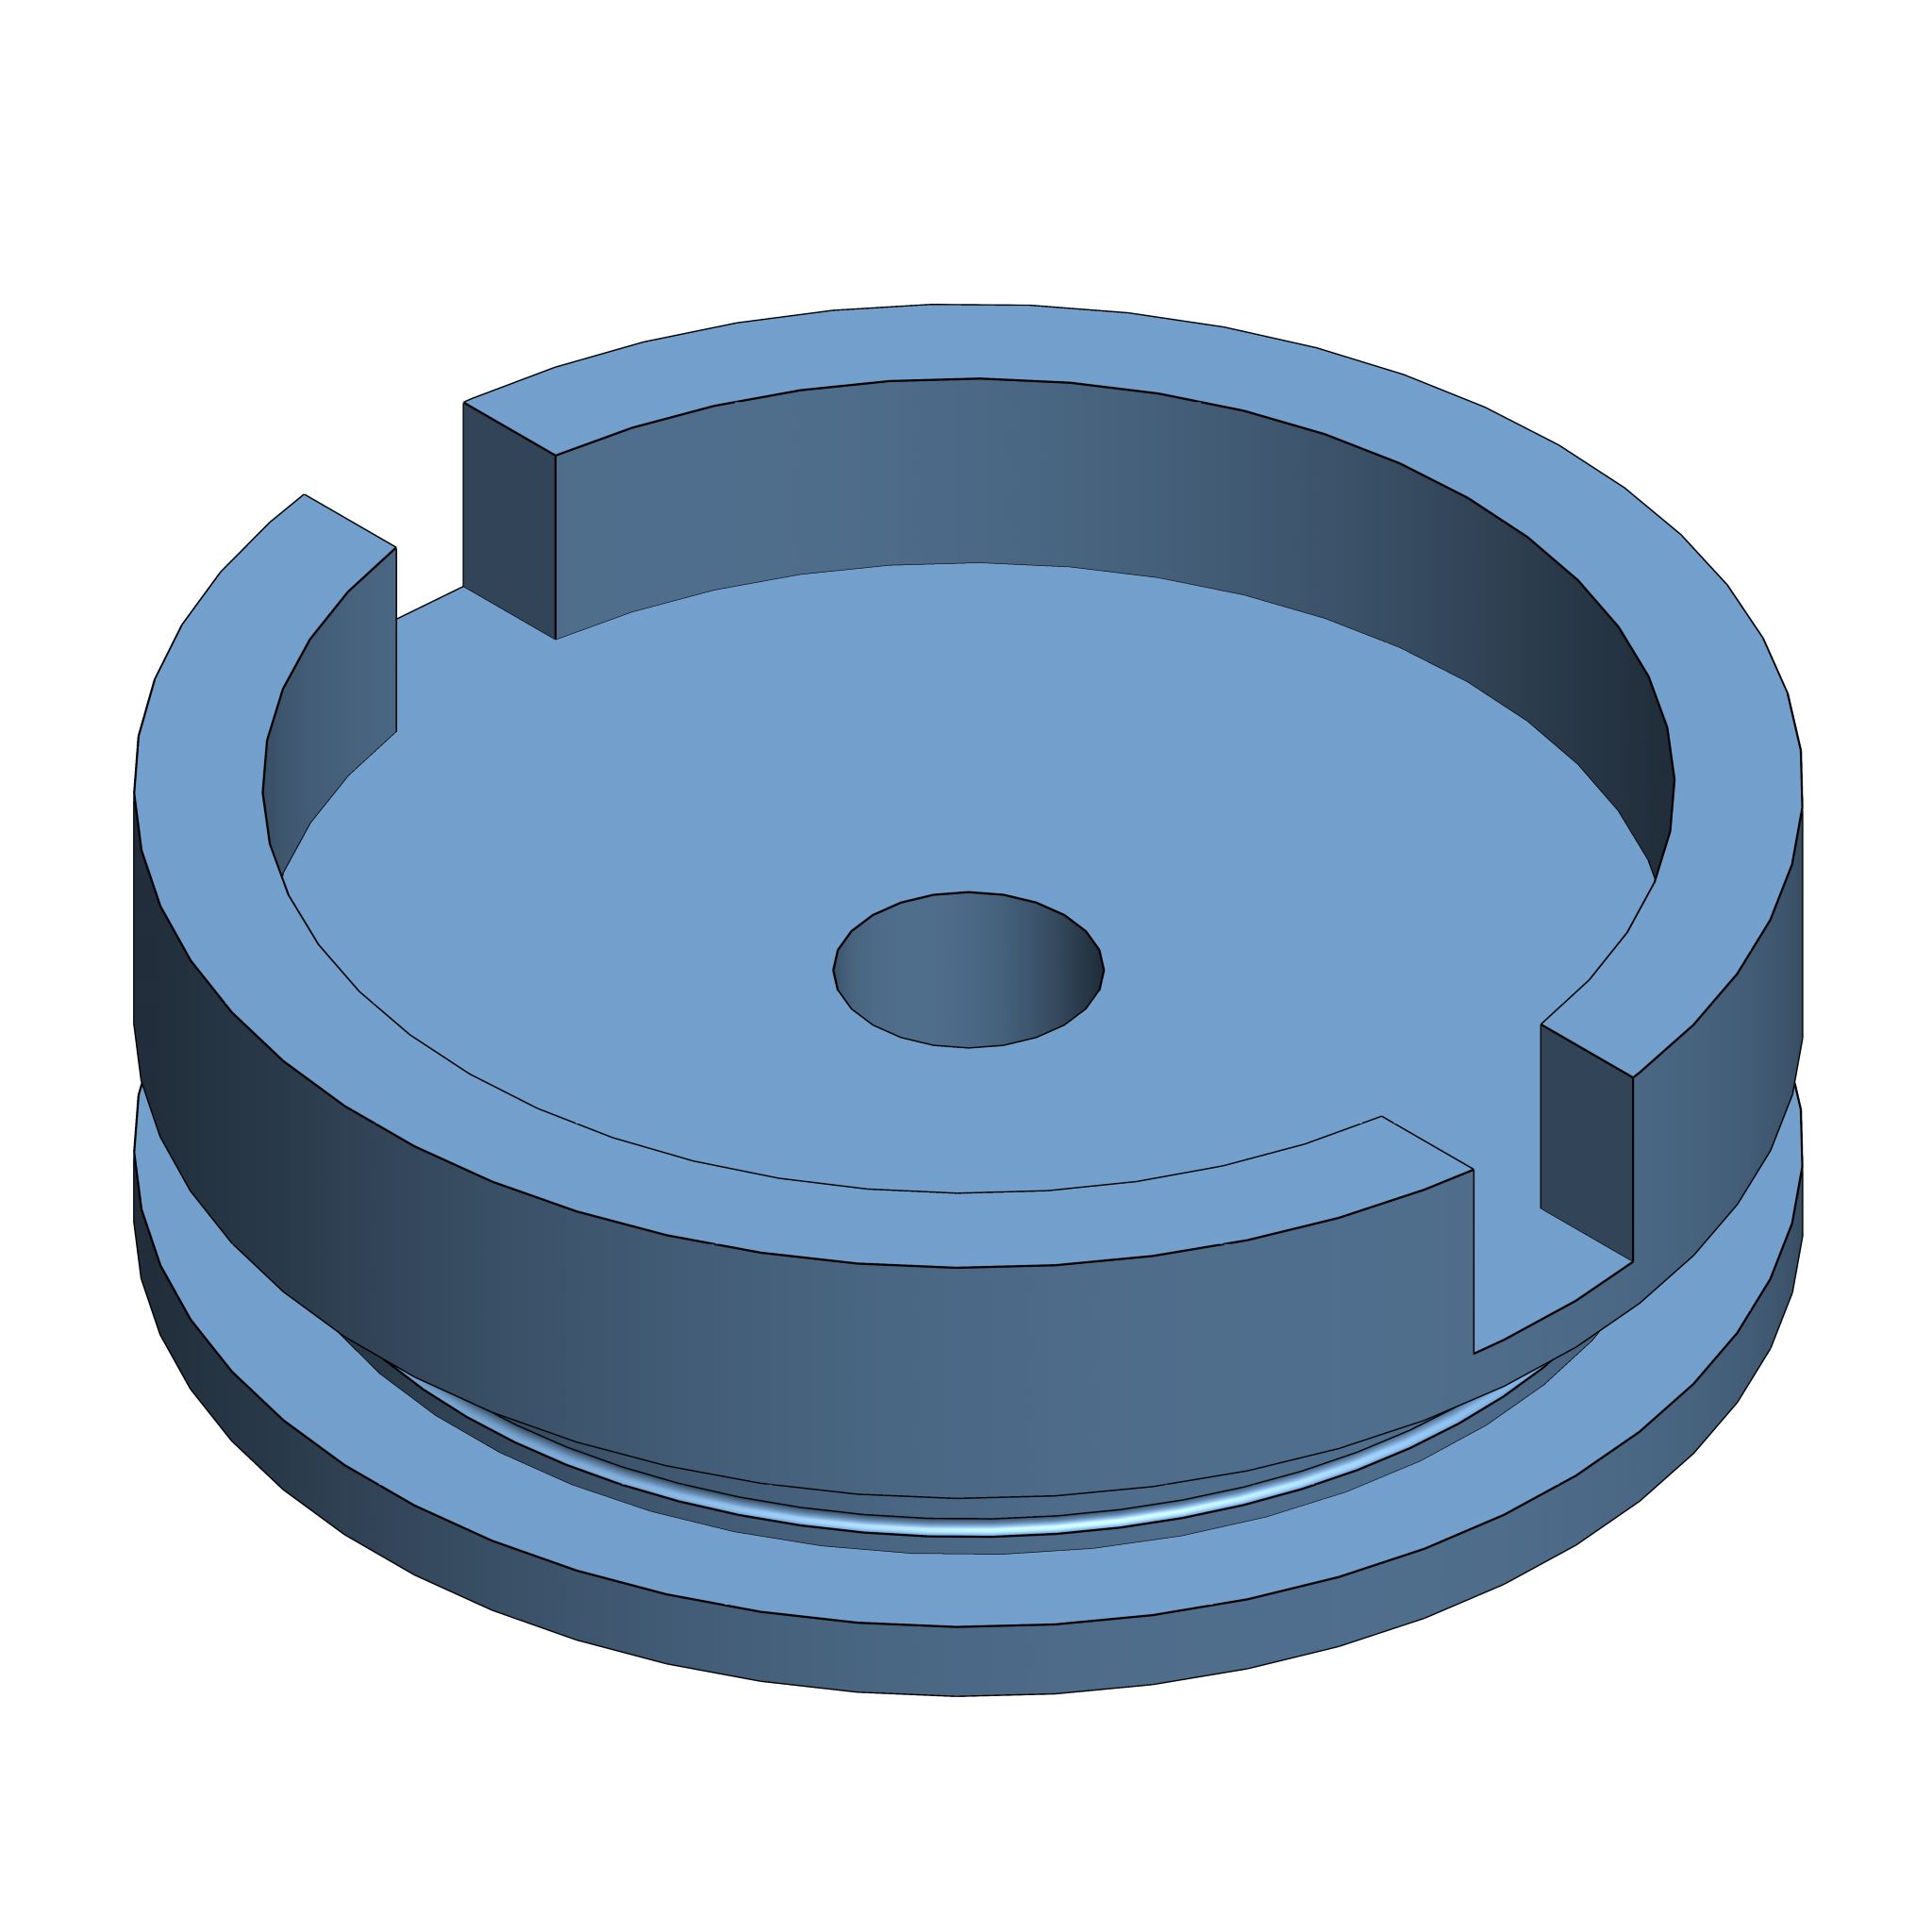
Stator mount.
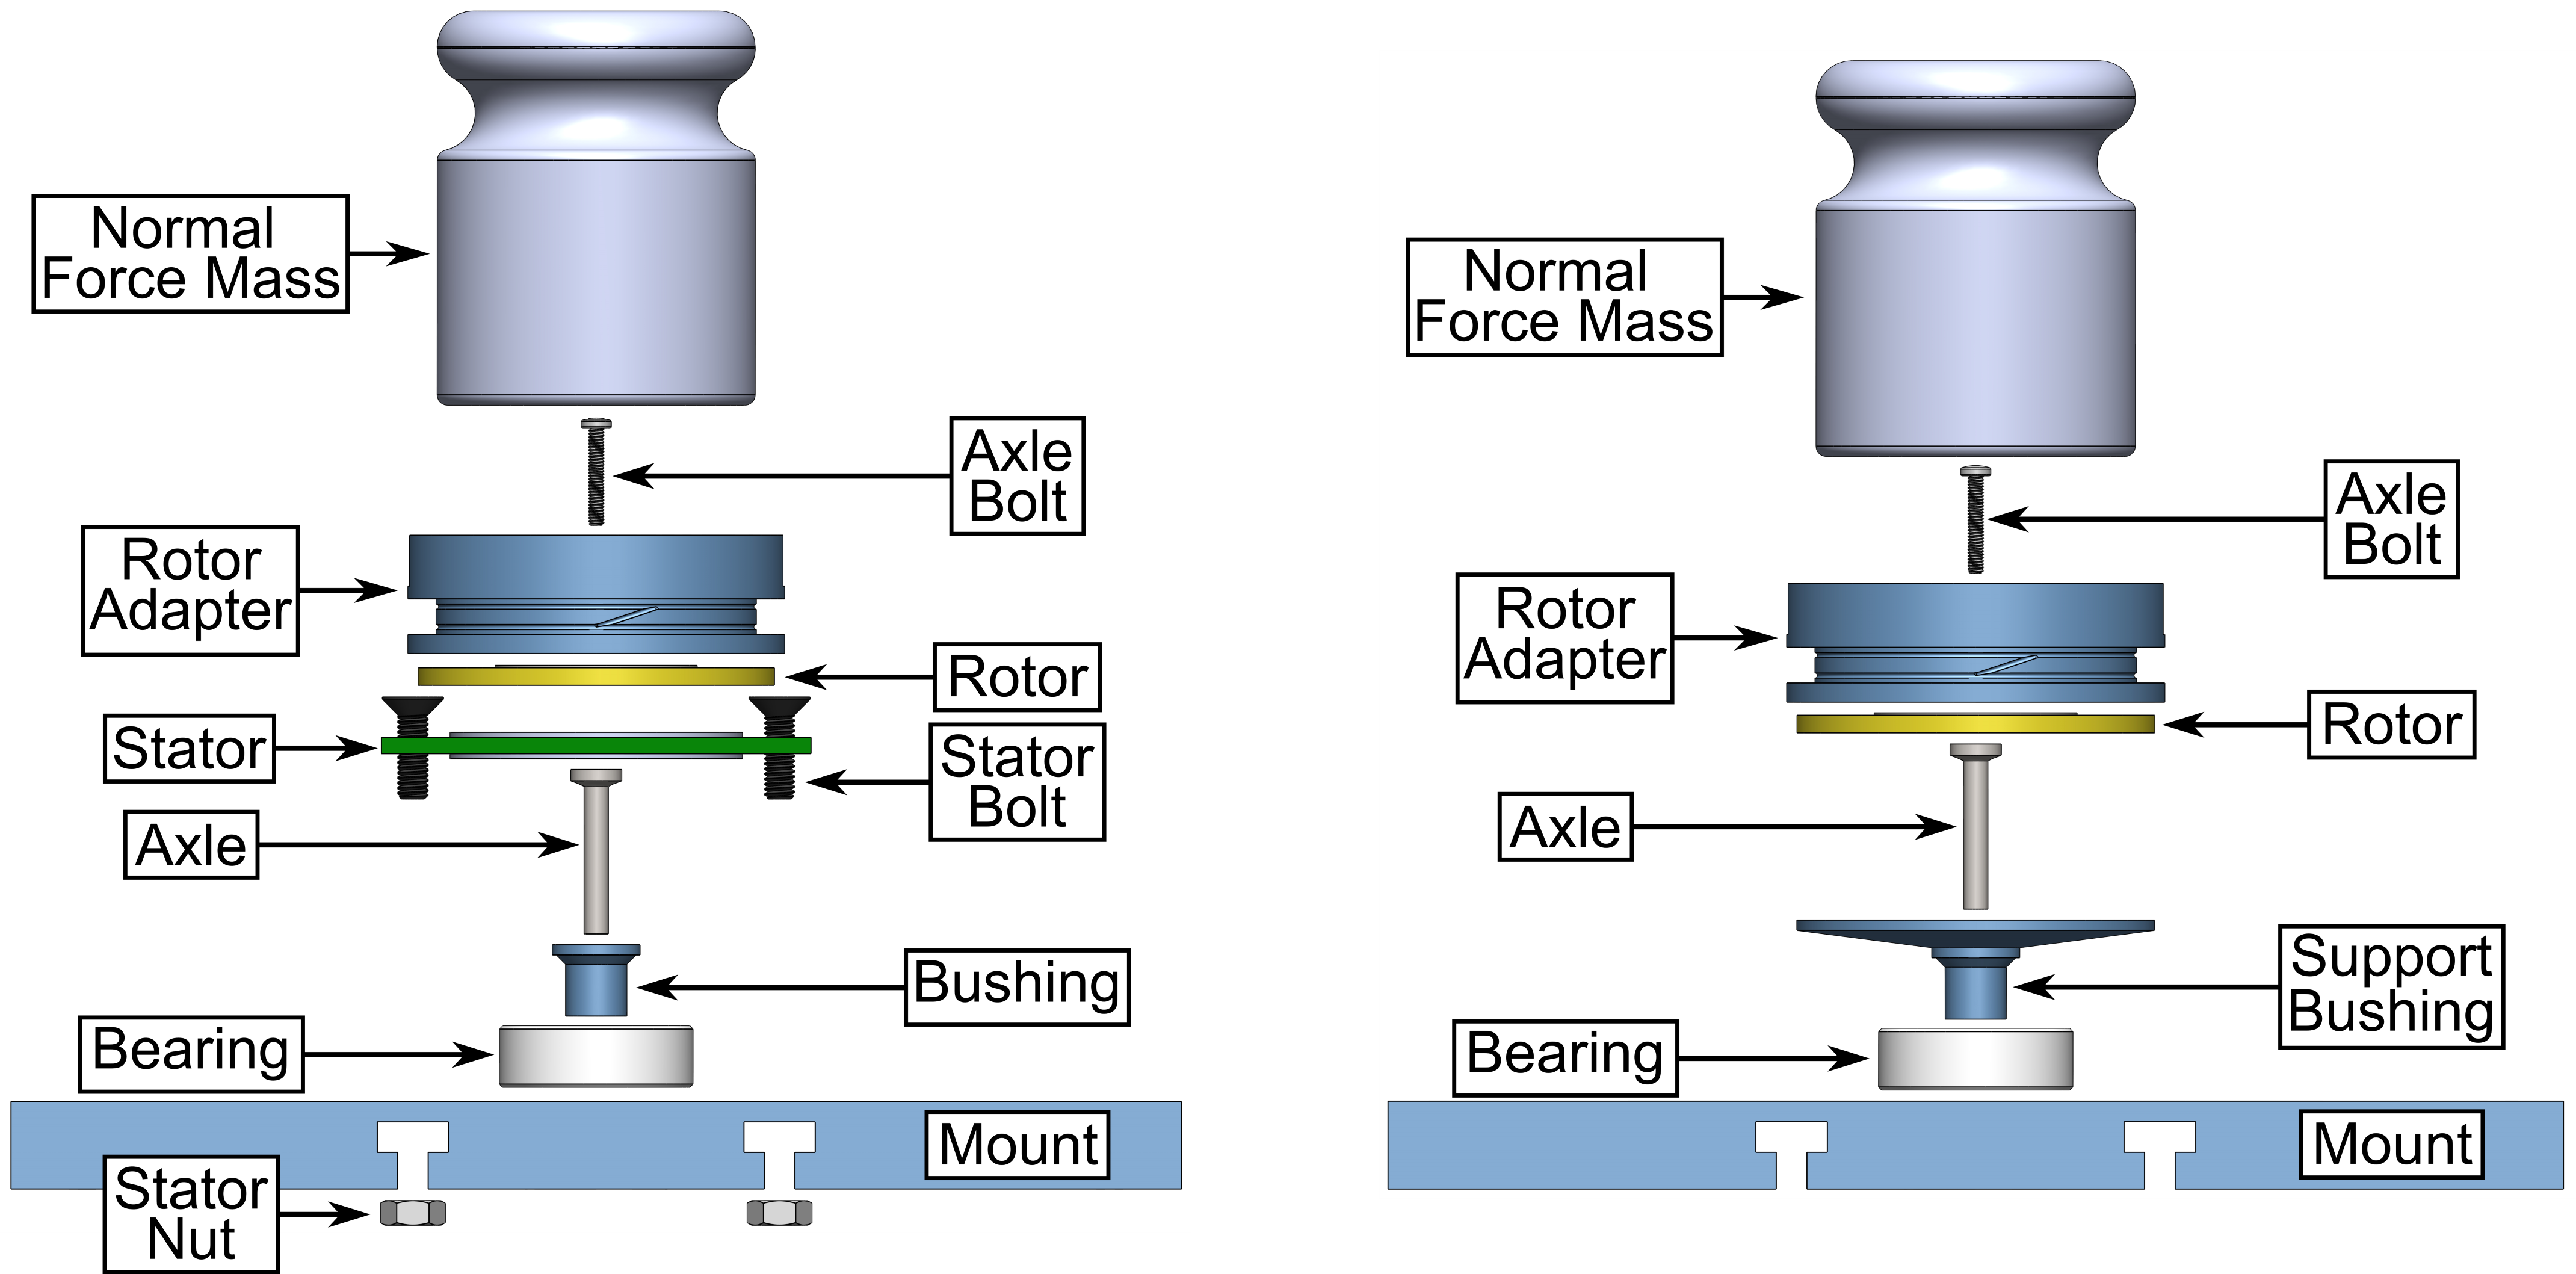
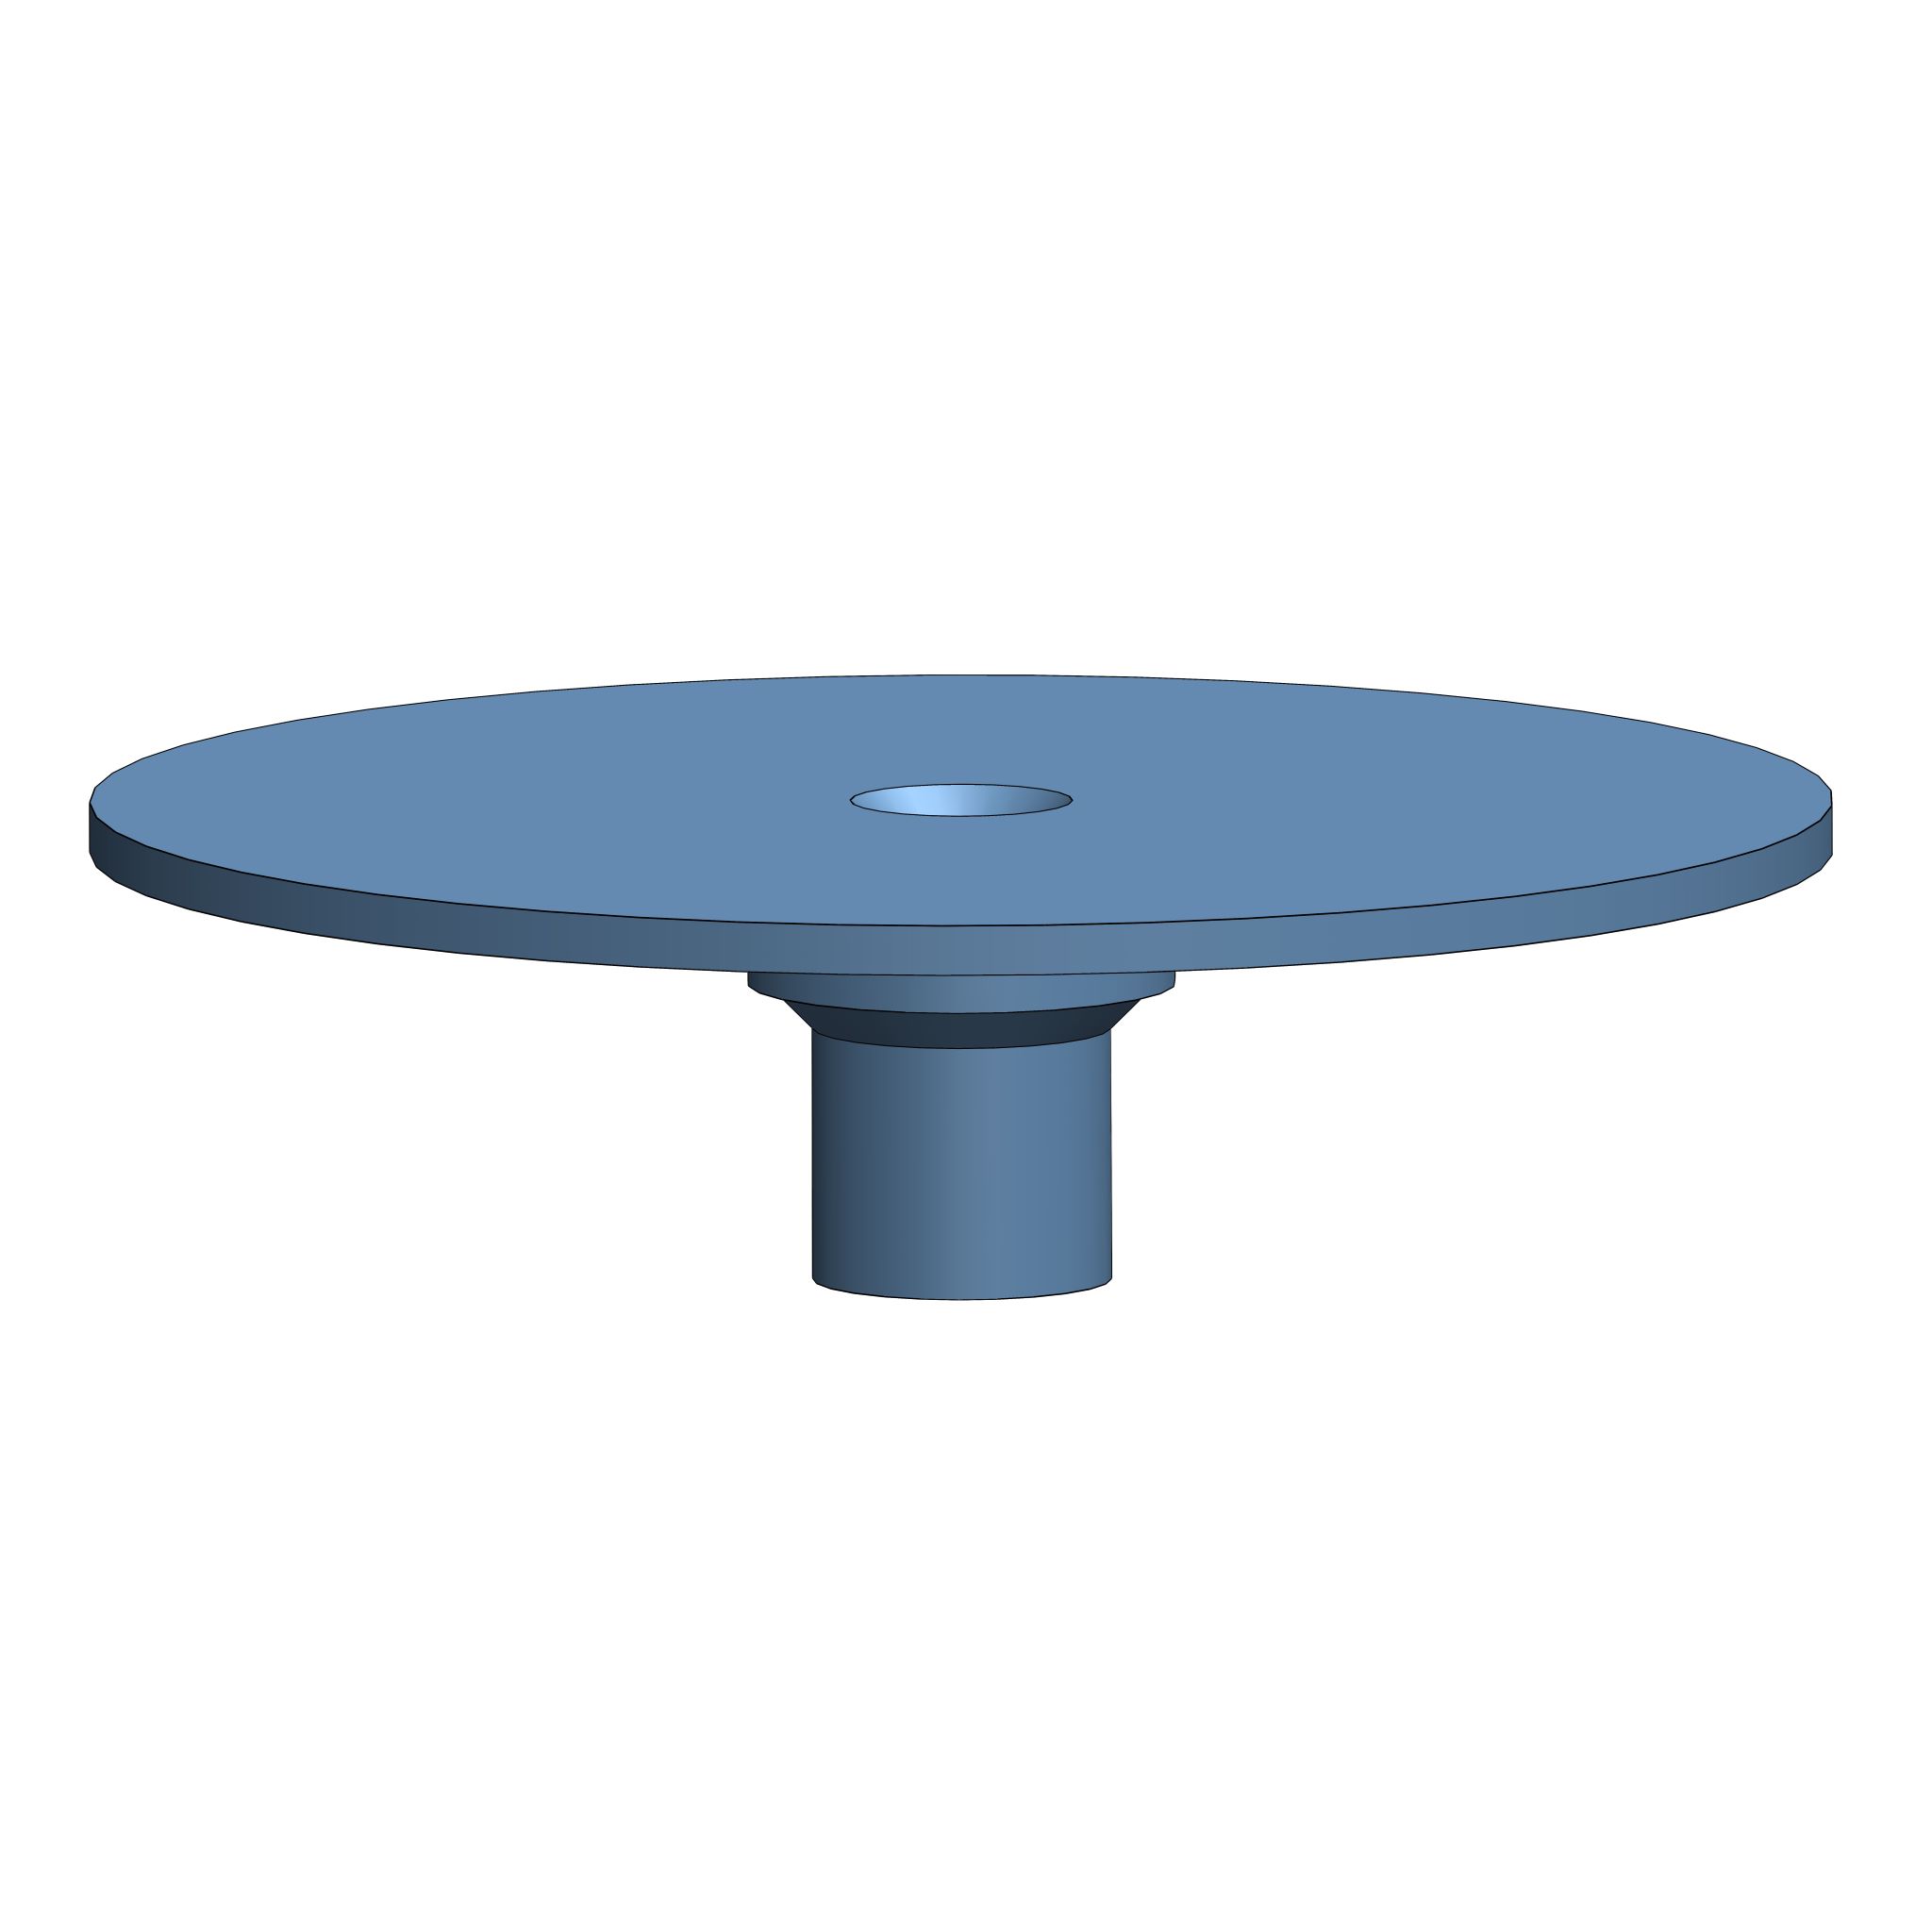
Rotor adapter.
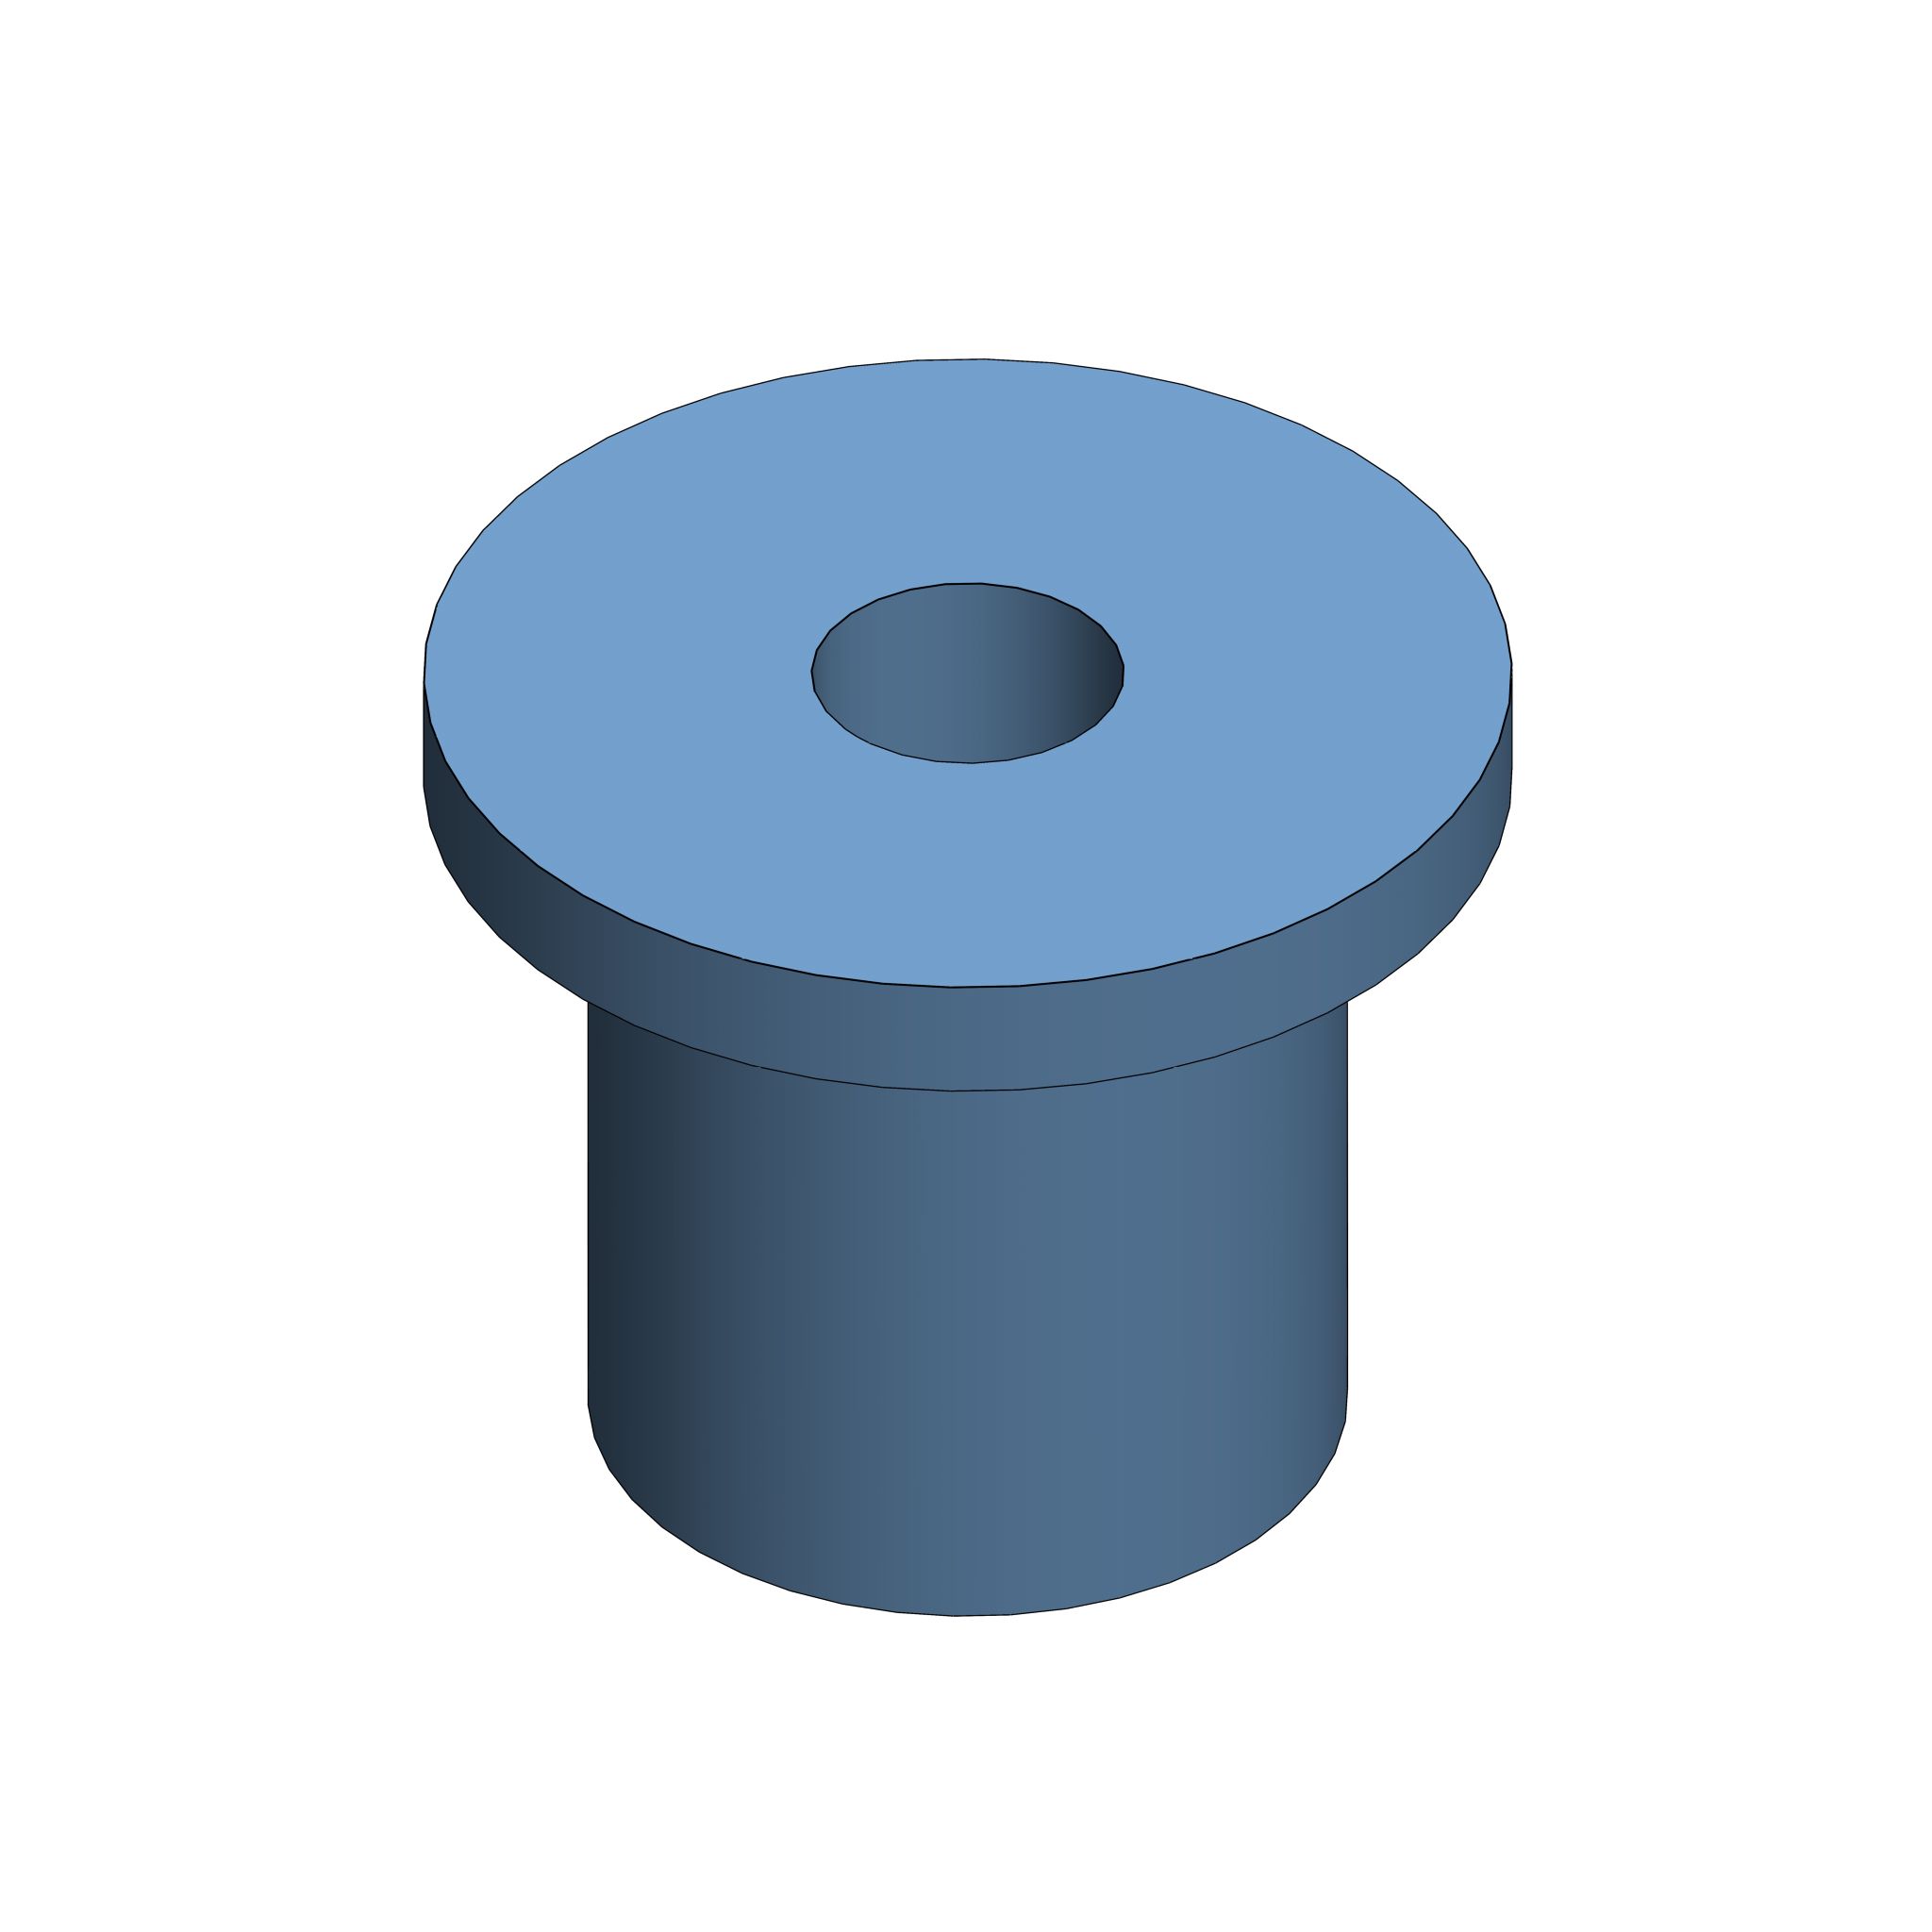
Bushing to ensure concentric rotation of the rotor.
Support bushing to allow the rotor to rotate freely.
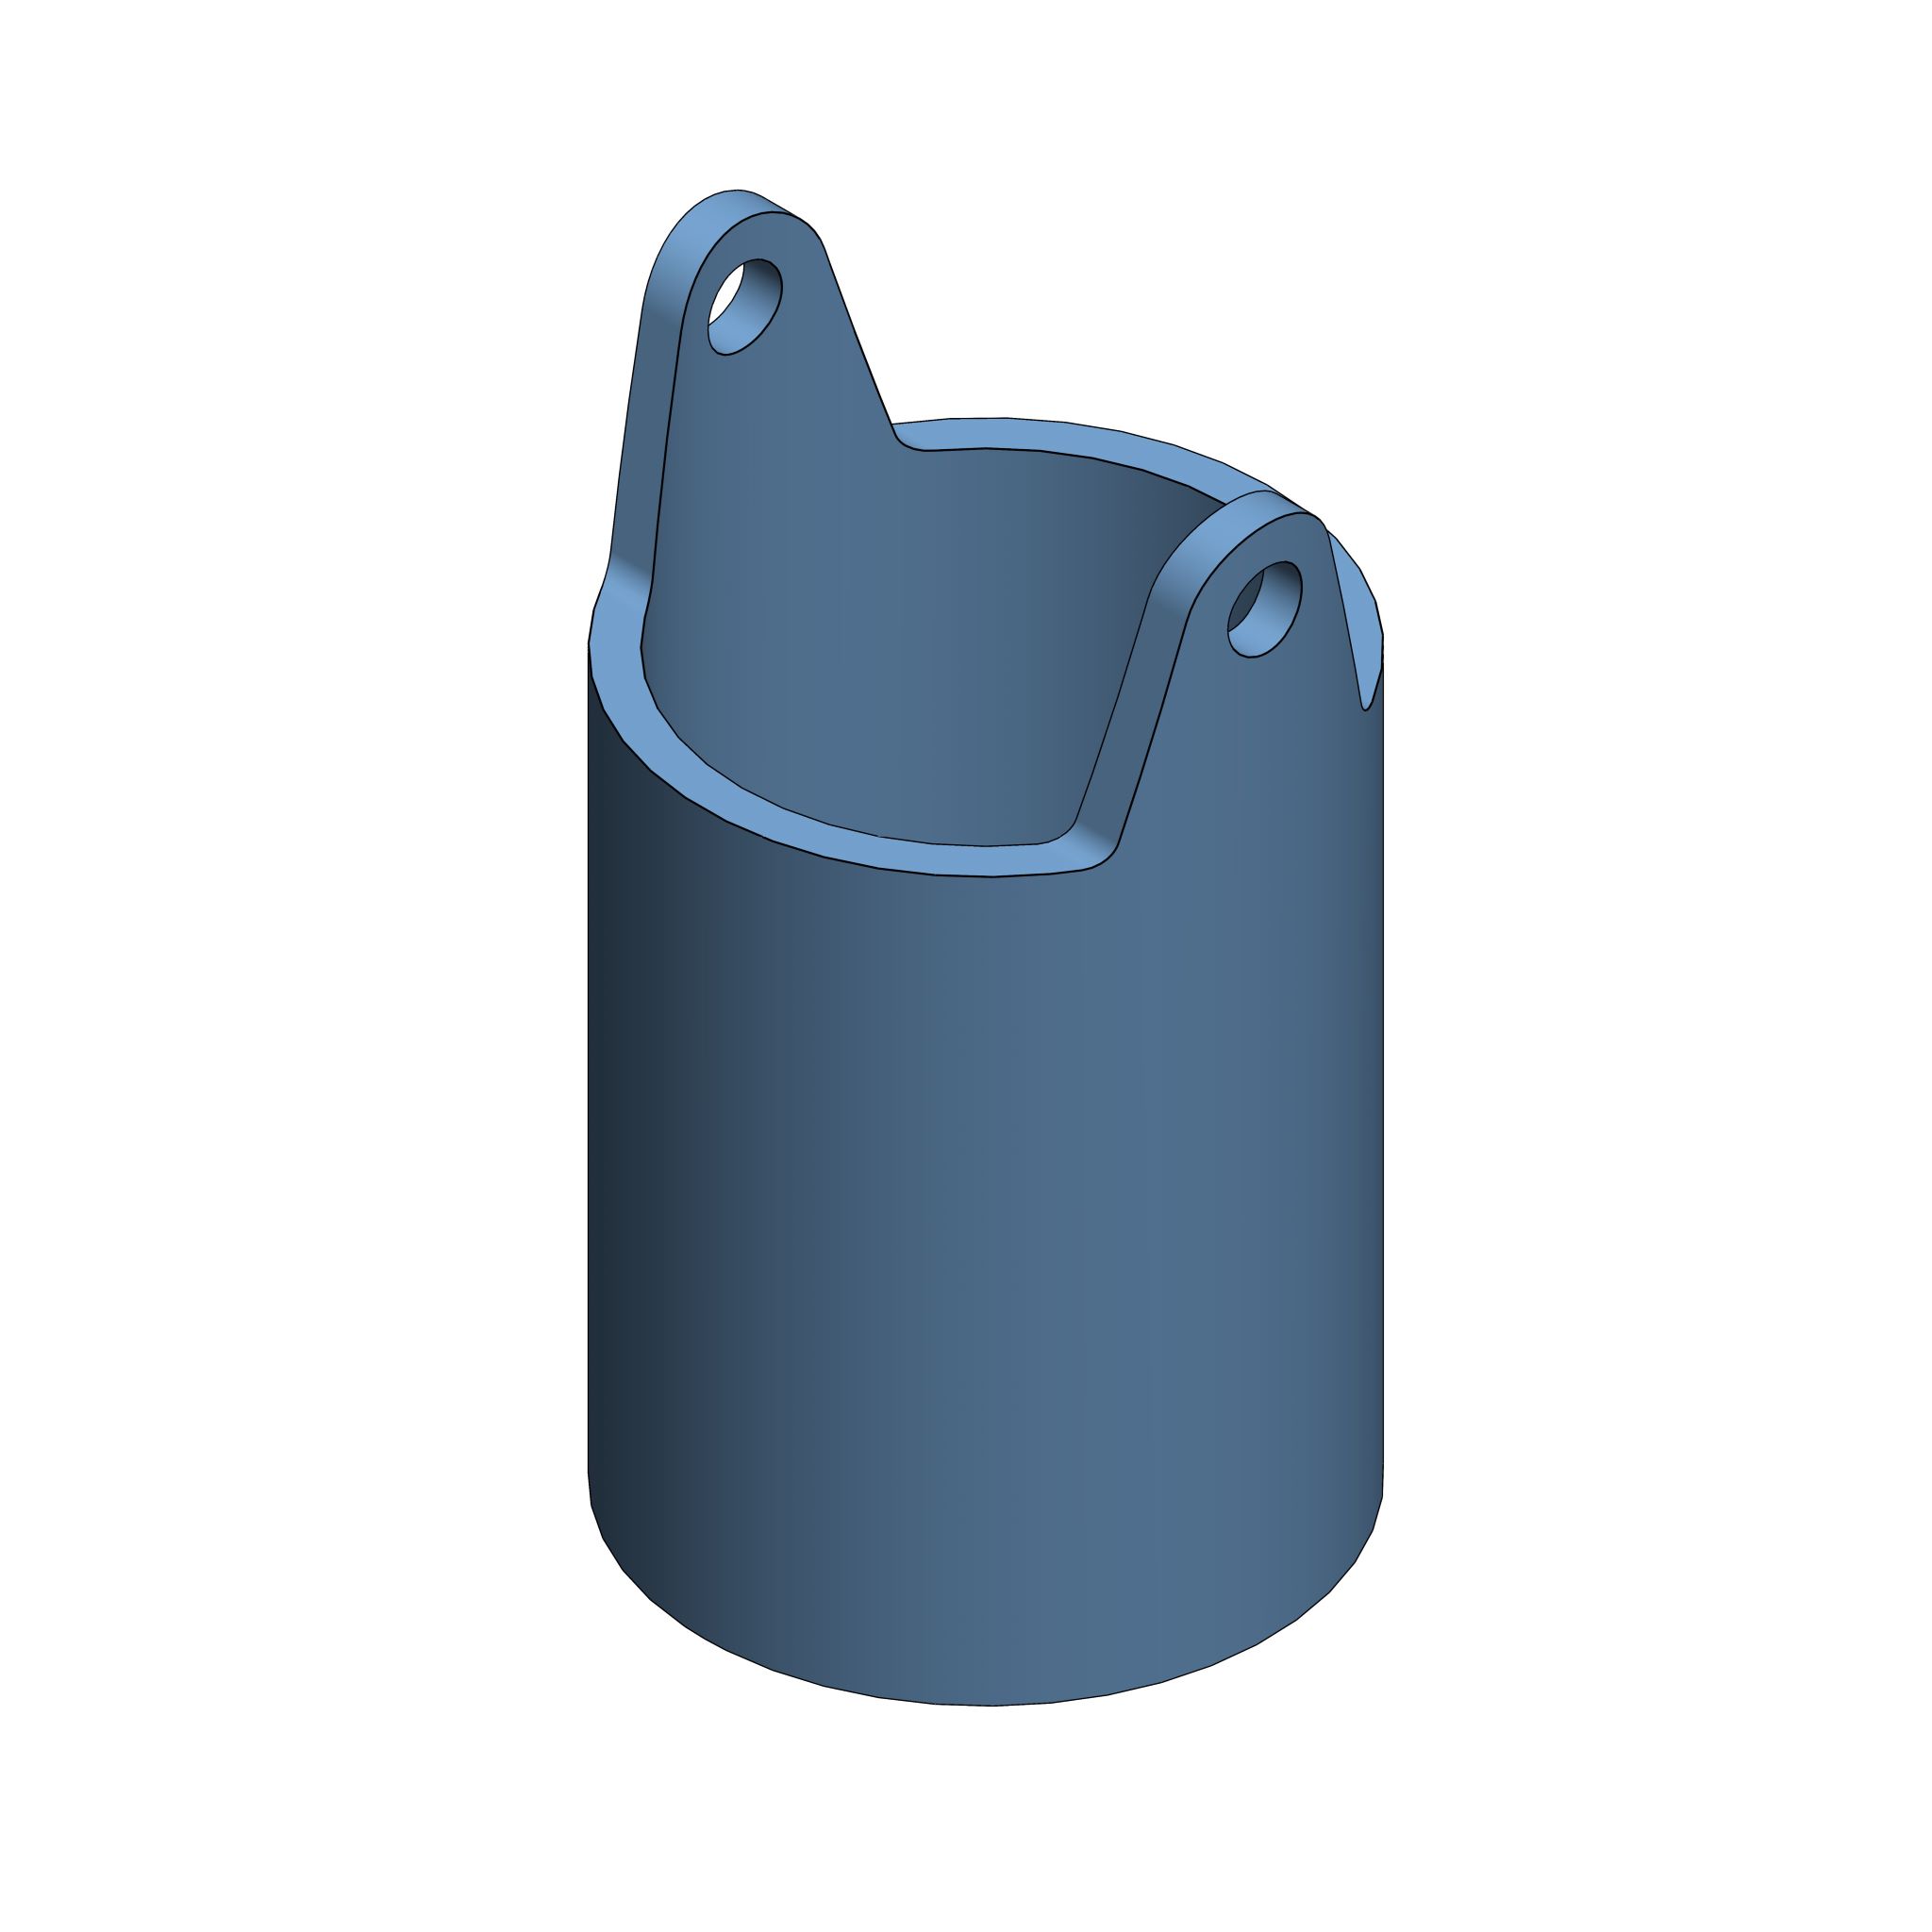
Hanging mass basket.
Physical Implementation
Results
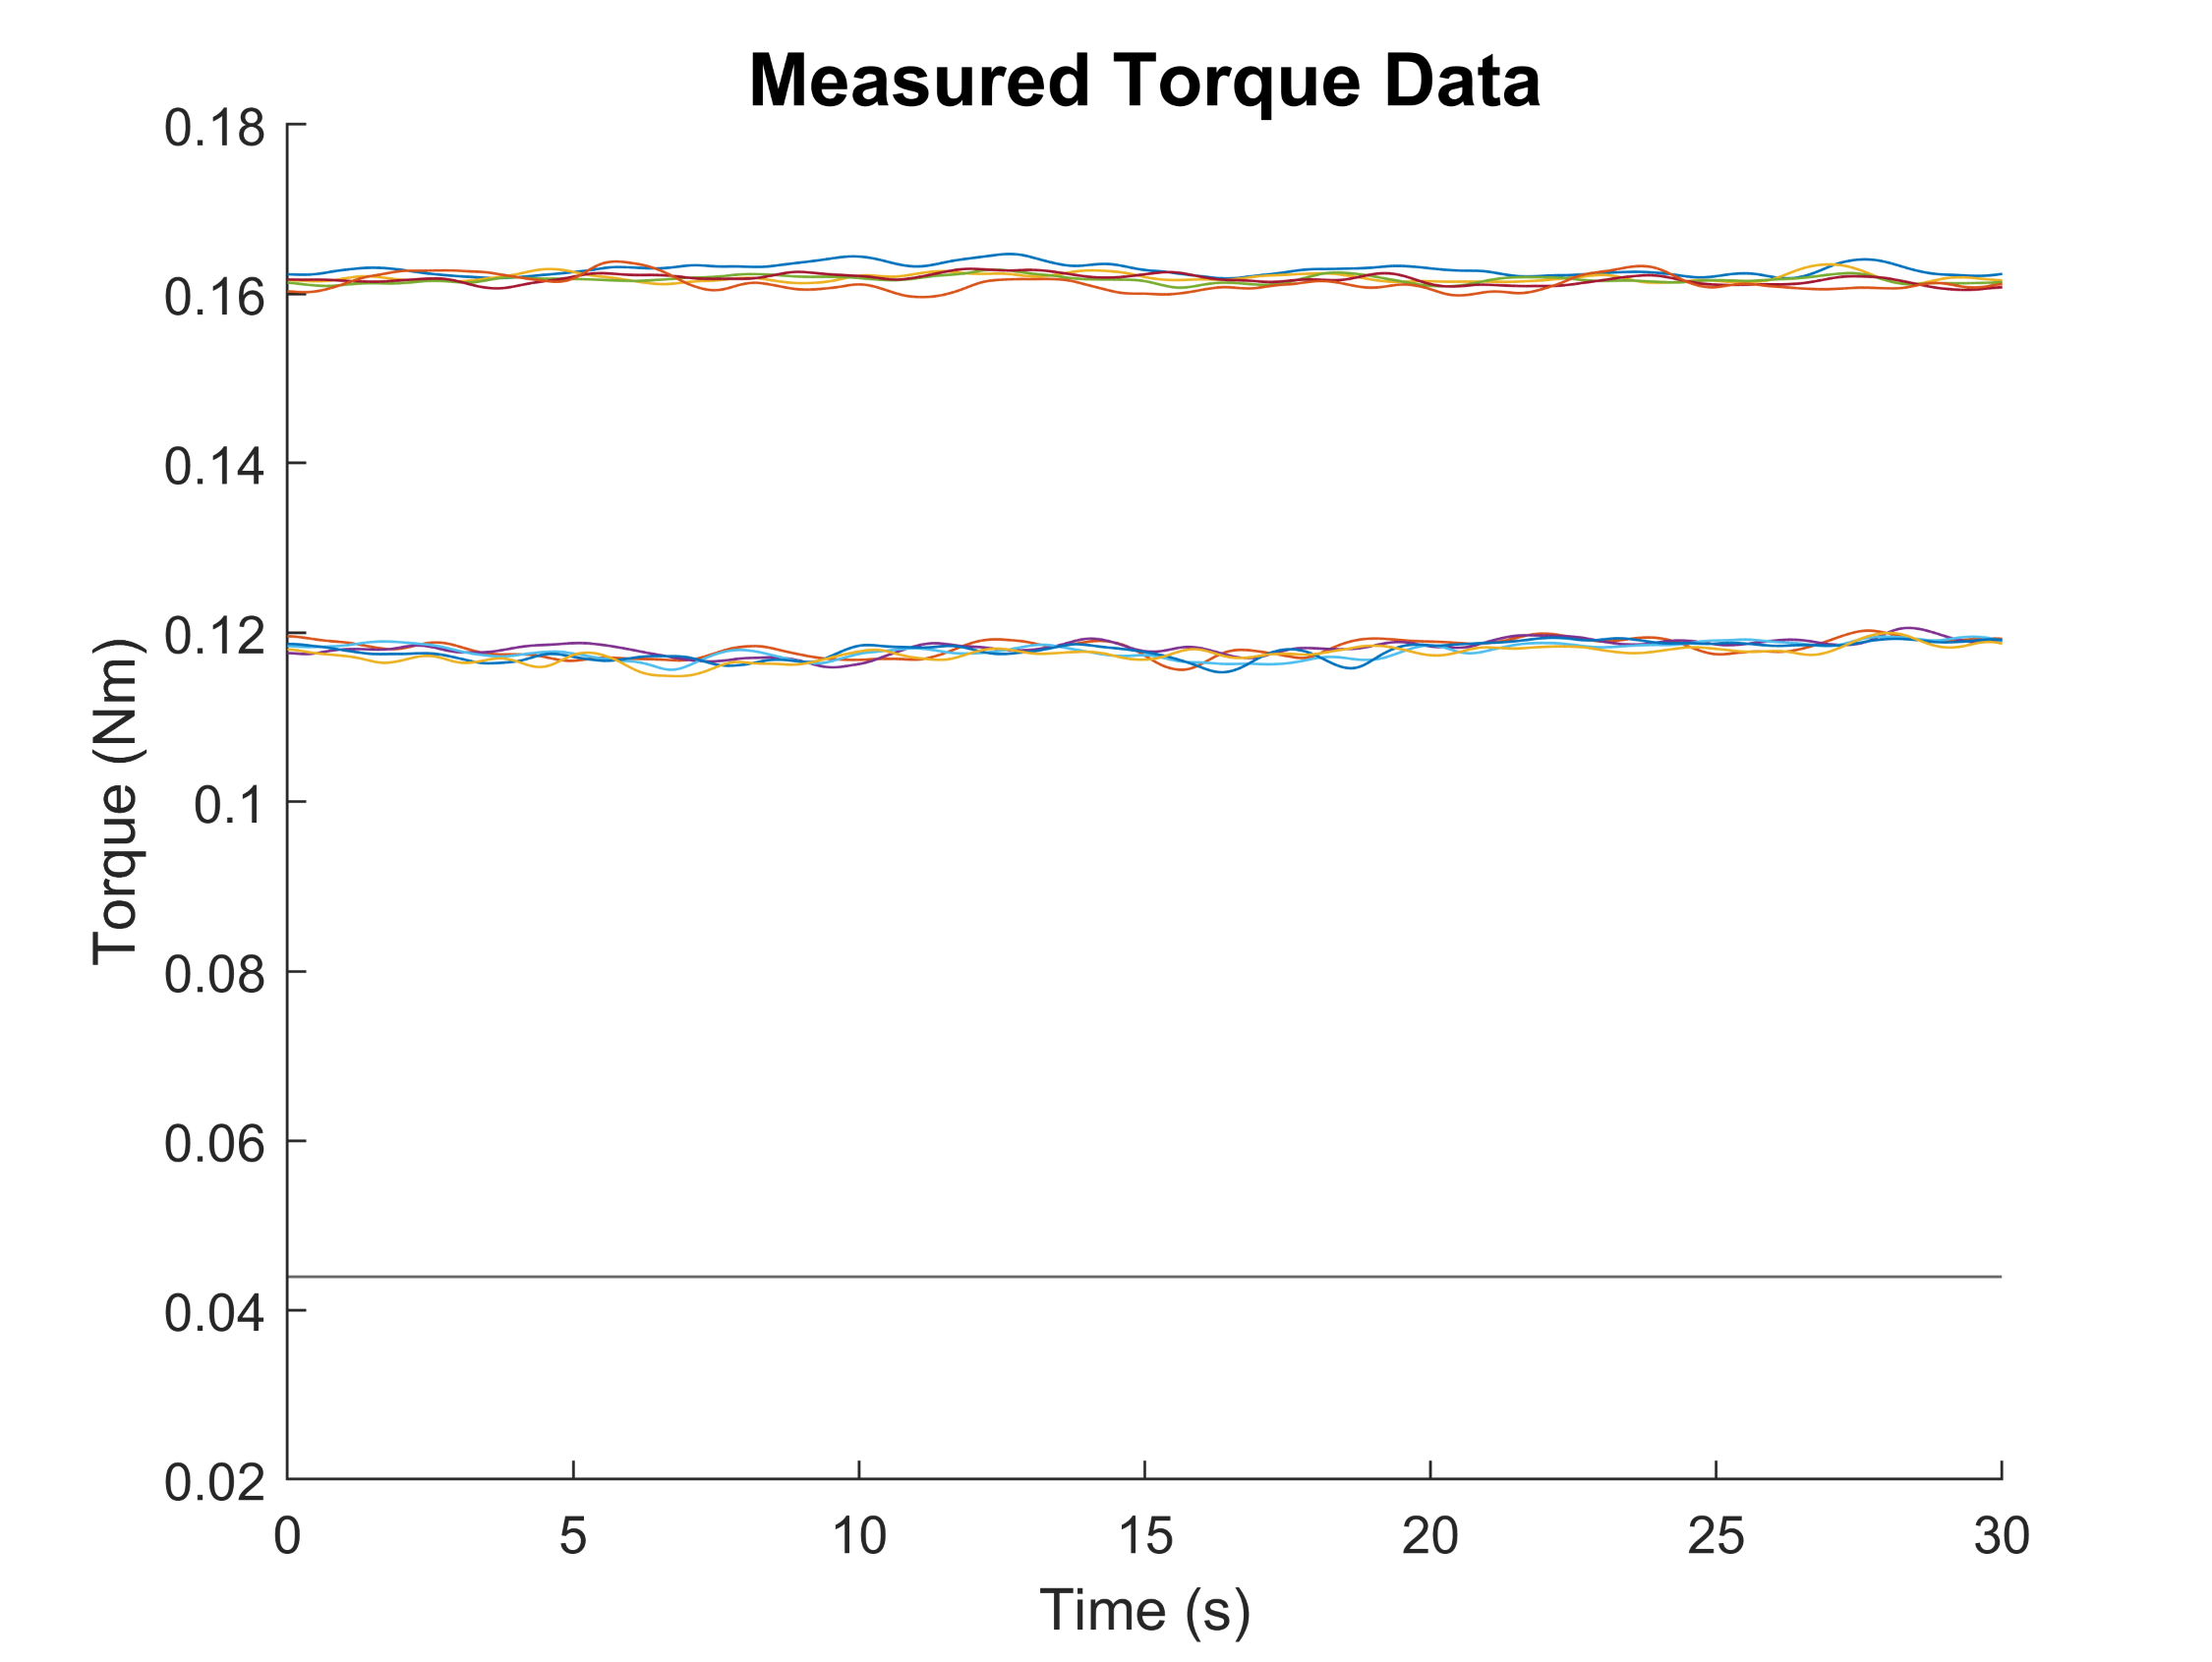
The top group is the measured torque from the setup when the rotor rotated while in contact with the stator, and the bottom group is when it could rotate freely. The clear distinction between the two groups can be confidently attributed to the torque produced by the frictional forces between the rotor and the stator, which is shown as the black line. Overall, the testing setup was extremely repeatable as it displayed a standard deviation of only 1.186% and 1.09% from the mean torque values of the friction and friction-less testing scenarios, respectively.
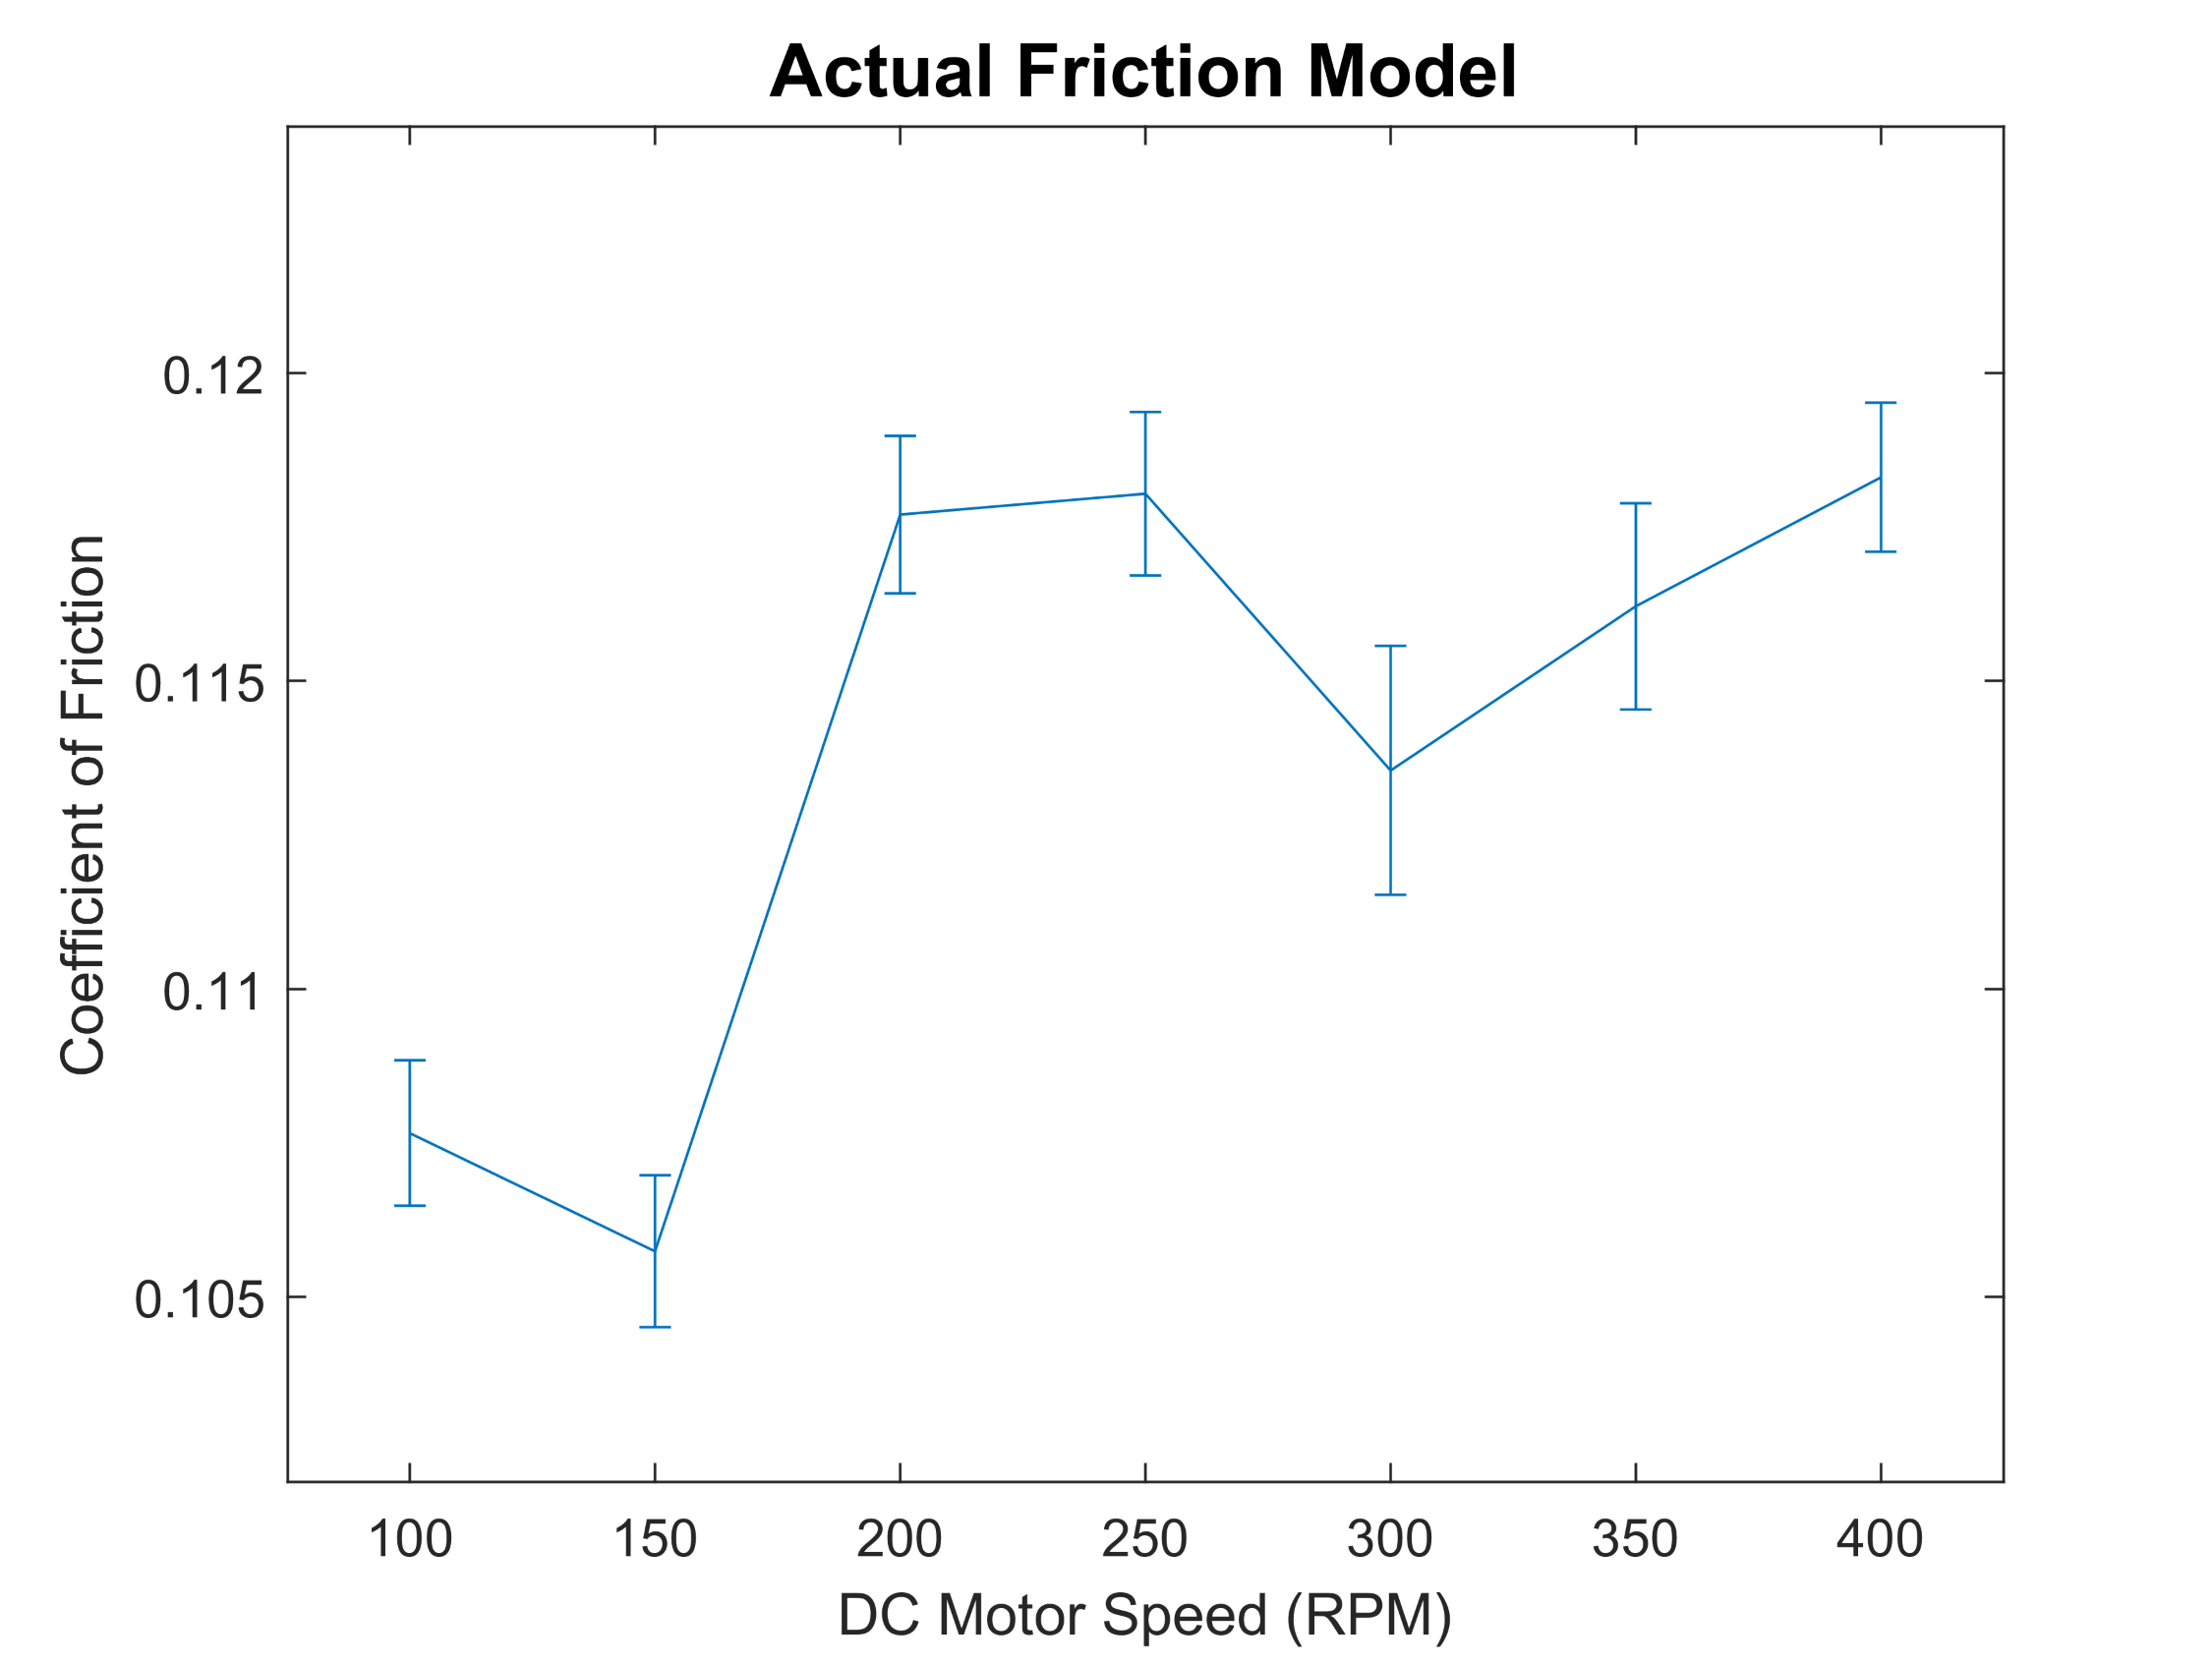
The resulting friction model was quite similar to the expected relation shown above. The clear initial valley can confidently be assigned the Coulomb friction valley, resulting in a coefficient of 0.1057.